Fundamentals of Geotechnical Engineering (MindTap Course List)
5th Edition
ISBN: 9781305635180
Author: Braja M. Das, Nagaratnam Sivakugan
Publisher: Cengage Learning
expand_more
expand_more
format_list_bulleted
Concept explainers
Videos
Textbook Question
Chapter 2, Problem 2.7P
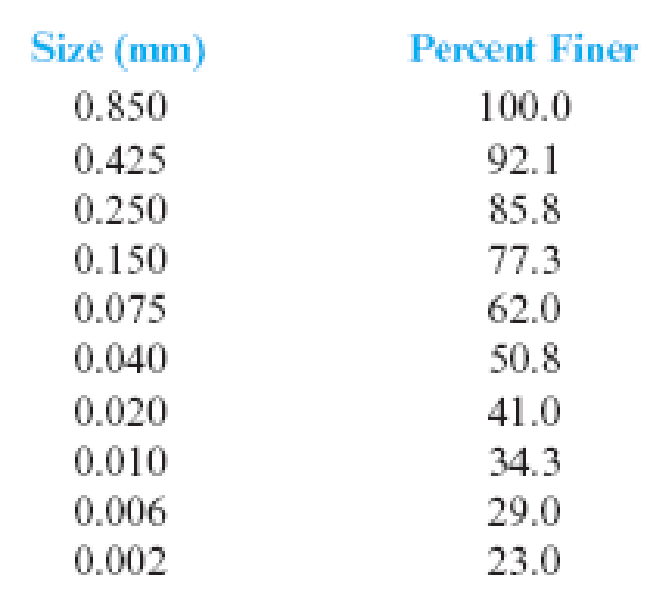
The particle characteristics of a soil are given below. Draw the particle-size distribution curve and find the percentages of gravel, sand, silt, and clay according to the MIT system (Table 2.3).
Expert Solution & Answer

Trending nowThis is a popular solution!

Students have asked these similar questions
The following are the results of a sieve and hydrometer analysis.
Analysis
Sieve number/grain size
Percent finer
Sieve
40
100
80
97
170
92
200
90
Hydrometer
0.04 mm
74
0.015 mm
42
0.008 mm
27
0.004 mm
17
0.002 mm
11
a. Draw the grain-size distribution curve.
b. Determine the percentages of gravel, sand, silt and clay according to the
MIT system.
c. Repeat Part b according to the USDA system.
d. Repeat Part b according to the AASHTO system.
5. The results of a particle size analysis of a soil are given in the following table. The Atterberg
limit tests yielded LL=62, PL = 20.
Sieve Opening (mm)
Percent Coarser by Weight
Sieve No.
4.75
5.1
10
2.00
10.0
20
0.85
0.425
40.7
40
70.2
84.8
90.5
60
0.25
100
0.15
200
Pan
0.075
100
a) Draw the gradation curve for this soil
b) Determine the uniformity coefficient and the coefficient of curvature
c) Classify the soil using USCS and ASSHTO
d) Rate this soil as a subgrade for highway construction
The particle size characteristics of a soil are given in
the table. Using MIT method, determine:
Size (mm)
Percent Finer
4.75
84
1.18
75
0.033
60
0.01
51
0.0062
43
0.003
37
0.0018
34
1. Percentage of gravel (in 4 decimal places)
2. Percentage of sand (in 4 decimal places)
3. Percentage of silt (in 4 decimal places)
4. Percentage of clay (in 4 decimal places)
Chapter 2 Solutions
Fundamentals of Geotechnical Engineering (MindTap Course List)
Ch. 2 - Prob. 2.1PCh. 2 - Following are the results of a sieve analysis: a....Ch. 2 - For a soil, given: D10 = 0.08 mm D30 = 0.22 mm D60...Ch. 2 - For a soil, given: D10 = 0.08 mm D30 = 0.22 mm D60...Ch. 2 - Repeat Problem 2.2 with the following results of a...Ch. 2 - Repeat Problem 2.2 with the following results of a...Ch. 2 - The particle characteristics of a soil are given...Ch. 2 - Redo Problem 2.7 according to the USDA system...Ch. 2 - Redo Problem 2.7 according to the AASHTO system...Ch. 2 - In a hydrometer test, the results are as follows:...
Knowledge Booster


Learn more about
Need a deep-dive on the concept behind this application? Look no further. Learn more about this topic, civil-engineering and related others by exploring similar questions and additional content below.Similar questions
- The particle size characteristics of a soil are given in the table. Using USDA method, determine: Size (mm) | Percent Finer 4.75 88 0.85 76 0.044 72 0.033 65 0.0062 63 0.0025 58 0.0011 50 1. Percentage of gravel (in 4 decimal places) 2. Percentage of sand (in 4 decimal places) 3. Percentage of silt (in 4 decimal places) 4. Percentage of clay (in 4 decimal places)arrow_forwardThe following are the results of a sieve and hydrometer analysis: Sieve number/ Percent finer than Analysis grain size Sieve 20 100 30 96 40 90 60 76 80 65 200 34 Hydrometer 0.05 mm 27 0.03 mm 19 0.015 mm 0.006 mm 7 0.004 mm 0.0015 mm 5 a. Draw the grain-size distribution curve. b. Determine the percentages of gravel, sand, silt, and clay according to the MIT system. c. Determine the percentages of gravel, sand, silt, and clay according to the USDA system. d. Determine the percentages of gravel, sand, silt, and clay according to the AASHTO system.arrow_forward1. From the given soil samples below, (a) compute the effective size, uniformity coefficient, and coefficient of gradation (b) Determine the percent of gravel, sand, silt and clay of soil A using AASHTO Sieve size. 0.425 0.033 0.018 0.01 0.0062 0.0035 0.0018 0.001 Soil A Passing Finer (%) 100 90 80 70 60 50 40 35arrow_forward
- 2.8 2.7 The following are the results of a sieve and hydrometer analysis. Sieve number/ grain size Analysis Sieve Hydrometer Analysis Sieve 40 80 170 200 0.04 mm 0.02 mm 0.01 mm 0.005 mm 0.0015 mm Hydrometer Sieve number/ grain size Percent finer than a. Draw the grain-size distribution curve. b. Determine the percentages of gravel, sand, silt, and clay according to the MIT system. c. Repeat Part b according to the USDA system. d. Repeat Part b according to the AASHTO system. Repeat Problem 2.7 with the following data: 20 30 40 60 80 200 0.05 mm 0.03 mm 0.015 mm 0.006 mm 0.004 mm 0.0015 mm 100 96 85 80 59 39 26 15 8 Cengage Learning 2014 Percent finer than 100 96 90 76 65 34 27 19 11 7 6 5 Ⓒ Cengage Learning 2014arrow_forwardThe grain-size characteristics of soil re given in the following table. Use Table 2.3 for the analysis. Size (mm) Percent finer 0.425 100 0.1 79 0.04 57 0.02 48 0.01 40 0.002 35 0.001 33 Table 2.3 Particle-Size Classifications Grain size (mm) Name of organization Gravel Sand Silt Clay Massachusetts Institute of Technology (MIT) >2 2 to 0.06 0.06 to 0.002 2 <0.002 76.2 to 2 2 to 0.075 0.075 to 0.002 <0.002 Fines (i.e., silts and clays) <0.075 76.2 to 4.75 4.75 to 0.075 Note: Sieve openings of 4.75 mm are found on a U.S. No. 4 sieve; 2-mm openings on a U.S. No. 10 sieve; 0.075-mm openings on a U.S. No. 200 sieve. See Table 2.5. i.) What is the percentages of gravel, sand, silt and clay according to the MIT system. a.) Gravel – 0%; Sand – 38%; Silt – 30%; Clay – 35% b.) Gravel – 0%; Sand – 37%; Silt – 30%; Clay – 35% c.) Gravel – 0%; Sand – 36%; Silt – 30%; Clay – 35% d.) Gravel – 0%; Sand – 35%; Silt – 30%; Clay – 35% e.) None of the abovearrow_forwardThe grain-size characteristics of soil re given in the following table. Use Table 2.3 for the analysis. Size (mm) Percent finer 0.425 100 0.1 79 0.04 57 0.02 48 0.01 40 0.002 35 0.001 33 Table 2.3 Particle-Size Classifications Grain size (mm) Name of organization Gravel Sand Silt Clay Massachusetts Institute of Technology (MIT) >2 2 to 0.06 0.06 to 0.002 2 <0.002 76.2 to 2 2 to 0.075 0.075 to 0.002 <0.002 Fines (i.e., silts and clays) <0.075 76.2 to 4.75 4.75 to 0.075 Note: Sieve openings of 4.75 mm are found on a U.S. No. 4 sieve; 2-mm openings on a U.S. No. 10 sieve; 0.075-mm openings on a U.S. No. 200 sieve. See Table 2.5. What is the percentages of gravel, sand, silt and clay according to the USDA system a.) Gravel – 0%; Sand – 38%; Silt – 26%; Clay – 35% b.) Gravel – 0%; Sand – 38%; Silt – 27%; Clay – 33% c.) Gravel – 0%; Sand – 38%; Silt – 26%; Clay – 34% d.) Gravel – 0%; Sand – 38%; Silt – 27%; Clay – 35% e.) None of the abovearrow_forward
- II. The grain size curve for soil sample is shown. 100 90 80 70 60 50 40 30 20 10 0 10 4. 5. 6. 1 Particle Size, mm. What is the effective grain size of the soil? What is the value of D60? 0.1 What is the value of the Coefficient of Gradation? 7. What is the value of the Coefficient of Uniformity? 8. What is the value of the Sorting Coefficient? Percent Finer, % 0.01arrow_forwardSituation. Given the size particle distribution of the soil, solve for the modified percentage of sand, silt, and clay. Gravel=24% Sand= 35% Silt= 25% Clay= 16% A 46%, 33%, 21% B 40%, 35%, 35% 42%, 33%, 25% D 38%, 33%, 29%arrow_forwardFor the sieve analysis test, the following data is obtained. Draw the grain size distribution curve and classify the soil according to the Unified Soil Classification. (Given: LL=36, PL=29): D (mm) 9.5 4 2.4 0.599 0.295 0.152 0.075 Passing (%) 100 100 98 60 30 20 10arrow_forward
- PROBLEM No. 3 The table below shows the laboratory results of the sieve analysis of Soil A and B. What is the classification of each soil according to the Unified Soil Classification System? Give the Group Symbol and Group Name. Percent Passing Sieve No. Diameter (mm) Soil A Soil B 4 4.760 100 90 8 2.380 99 64 10 2.000 98 58 20 0.850 92 35 40 0.425 70 22 60 0.250 46 15 100 0.150 25 10 200 0.074 4 D10 0.10 0.15 D30 0.17 0.66 D60 0.32 2.10arrow_forward2.3 The following are the results of a sieve analysis: Mass of soil retained (g) U.S. sieve no. 4 10 20 40 60 100 200 Pan 28 42 48 128 221 86 40 24 ⒸCengage Leaming 2014 a. Determine the percent finer than each sieve and plot a grain-size distribution curve. b. Determine D10, D30, and D60 from the grain-size distribution curve. c. Calculate the uniformity coefficient, C₁- d. Calculate the coefficient of gradation, C.arrow_forwardThe following are the results of sieve analysis: U.S. Sieve No. Mass of Soil Retained 4 0 10 44 20 56 40 82 60 51 80 106 100 92 200 85 Pan 35 a. Determine the percent finer than each sieve and plot a grain-size distribution curve. b. Determine D10, D30, and D60. c. Calculate the uniformity coefficient d. Calculate the coefficient of gradationarrow_forward
arrow_back_ios
SEE MORE QUESTIONS
arrow_forward_ios
Recommended textbooks for you
 Fundamentals of Geotechnical Engineering (MindTap...Civil EngineeringISBN:9781305635180Author:Braja M. Das, Nagaratnam SivakuganPublisher:Cengage Learning
Fundamentals of Geotechnical Engineering (MindTap...
Civil Engineering
ISBN:9781305635180
Author:Braja M. Das, Nagaratnam Sivakugan
Publisher:Cengage Learning
How Are Highways Designed?; Author: Practical Engineering;https://www.youtube.com/watch?v=9XIjqdk69O4;License: Standard Youtube License