
The production possibilities curve for 2018 and 2022.
Explanation of Solution
Figure 1 shows the production possibilities curve for 2018 and 2022.
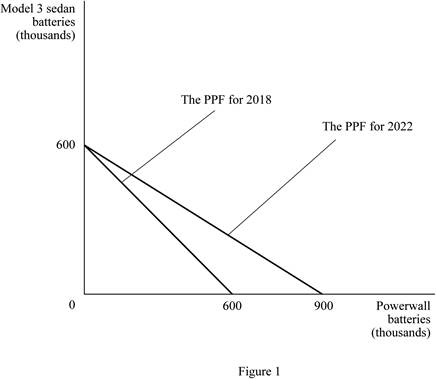
Figure 1
In the above graph, the vertical axis measures the quantity of Powerwall batteries and the horizontal axis measures the quantity of Model 3 sedan’s batteries. In 2018, the maximum production is 600 thousands of Model 3 sedan’s batteries or 600 thousands Powerwall batteries. In 2022, the maximum production is 600 thousands of sedan 3 batteries or 900 thousands power wall batteries.
Thus, the opportunity cost of producing one Model 3 sedan’s battery in 2018 is 1Powerwall battery.
Opportunity cost of producing one Model 3 sedan’s battery in 2022 is calculated as follows:
Thus, the opportunity cost of producing one Model 3 sedan’s battery in 2022 is 1.5 Powerwall batteries.
Concept introduction:
Opportunity cost: Opportunity cost refers to the value of forgone goods and services to receive the other goods and services.
Production Possibilities Frontier (
Want to see more full solutions like this?
Chapter 2 Solutions
Microeconomics (7th Edition)

- Suppose Ireland produces two types of goods: agricultural and capital. The following diagram shows its current production possibilities frontier for corn, an agricultural good, and industrial robots, a capital good. Drag the production possibilities frontier (PPF) on the graph to show the effects of a long drought that reduces the amount of water available for farmers to use for irrigation. Note: Select either end of the curve on the graph to make the endpoints appear. Then drag one or both endpoints to the desired position. Points will snap into position, so if you try to move a point and it snaps back to its original position, just drag it a little farther. 120 100 PPF 80 20 PPE 60 120 180 240 300 360 CORN (Millions of bushels) INDUSTRIAL ROBOTS (Thousands)arrow_forwardSupermarché Jean Claude has decided to manufacture its own brand of non-alcoholic beverages, called NAB, and chocolate bars, called S-JC. A certain amount of money has been allocated to the production of these two products. Jean Claude believes in the old saying that a picture is worth a thousand words, and once again, he has called on you. This time, he wants to see diagrams that illustrate the effects of each of the following events on the production possibilities for NABS and S-JCs so he can visualize the situation. (a) A new and more efficient method of producing non-alcoholic beverages is discovered. (b) The demand for both non-alcoholic beverages and chocolate bars increases. (c) More workers are hired to produce S-JCs. (d) Resources are transferred from S-JC production to NAB production. (e) All workers are trained so that the quality of their labour services improves. Instructions Produce the series of graphs with accompanying texts (150-175 words) so that Uncle Jean Claude…arrow_forwardSuppose the Netherlands produces two types of goods: agricultural and capital. The following diagram shows its current production possibilities curve (also known as the production possibilities curve) for alfalfa, an agricultural good, and cars, a capital good. Drag the production possibilities curve (PPC) on the graph to show the effects of an agricultural innovation that increases the crop yield of each hectare of land. Note: Select either end of the curve on the graph to make the endpoints appear. Then drag one or both endpoints to the desired position. Points will snap into position, so if you try to move a point and it snaps back to its original position, just drag it a little farther. (? 540 450 PPC 360 270 O 180 90 PPC 50 100 150 200 250 300 ALFALFA (Millions of bushels) CARS (Thousands)arrow_forward
- Suppose Canada produces two types of goods: agricultural and capital. The following diagram shows its current production possibilities curve (PPC) for wheat, an agricultural good, and industrial robots, a capital good. Drag the production possibilities curve (PPC) on the graph to show the effects of a breakout of a pandemic that sickens millions of workers. Note: Select either end of the curve on the graph to make the endpoints appear. Then drag one or both endpoints to the desired position. Points will snap into position, so if you try to move a point and it snaps back to its original position, just drag it a little farther. (?) INDUSTRIAL ROBOTS (Thousands) 420 350 280 210 140 70 0 40 PPC 80 120 160 WHEAT (Millions of bushels) 200 240 68 PPCarrow_forwardSuppose France produces two types of goods: wheat and cars. The following diagram shows its current production possibilities frontier (also known as the production possibilities curve) for wheat and cars. Drag the production possibilities frontier (PPF) on the graph to show the effects of a long drought that reduces the amount of water available for farmers to use for irrigation. Note: Select either end of the curve on the graph to make the endpoints appear. Then drag one or both endpoints to the desired position. Points will snap into position, so if you try to move a point and it snaps back to its original position, just drag it a little farther.arrow_forwardSuppose the fictional country of Everglades produces two types of goods: agricultural and capital. The following diagram shows its current production possibilities frontier for millet, an agricultural good, and telephoto lenses, a capital good. Drag the production possibilities frontier (PPF) on the graph to show the effects of a long drought that reduces the amount of water available for farmers to use for irrigation. Note: Select either end of the curve on the graph to make the endpoints appear. Then drag one or both endpoints to the desired position. Points will snap into position, so if you try to move a point and it snaps back to its original position, just drag it a little farther. TELEPHOTO LENSES (Thousands) 360 300 240 100 120 60 . 10 PPF 20 30 40 MILLET (Millions of bushels) 50 60 PPFarrow_forward
- Suppose the United Kingdom produces two types of goods: agricultural and capital. The following diagram shows its current production possibilities frontier for corn, an agricultural good, and airplanes, a capital good. Drag the production possibilities frontier (PPF) on the graph to show the effects of a technological advance in medicine that allows workers to live longer and have extended careers. Note: Select either end of the curve on the graph to make the endpoints appear. Then drag one or both endpoints to the desired position. Points will snap into position, so if you try to move a point and it snaps back to its original position, just drag it a little farther. 360 300 PPF 240 180 PLANES (Thousands) Carrow_forwardSuppose the fictional country of Everglades produces two types of goods: agricultural and capital. The following diagram shows its current production possibilities frontier for millet, an agricultural good, and electric scooters, a capital good. Drag the production possibilities frontier (PPF) on the graph to show the effects of a breakout of avian flu that sickens millions of workers. Note: Select either end of the curve on the graph to make the endpoints appear. Then drag one or both endpoints to the desired position. Points will snap into position, so if you try to move a point and it snaps back to its original position, just drag it a little farther. PPF0701402102803504201801501209060300ELECTRIC SCOOTERS (Thousands)MILLET (Millions of bushels) PPFarrow_forwardA company that produces brass hardware for doors has the ability to produce up to 6,500 hinges per week but then is unable to produce doorknobs. Or it can produce up to 650 doorknobs per week but then is unable to produce any hinges. In the graph below, use the straight-line tool to draw the company's production possibilities frontier, where the quantities are per week (do not use the point tool to plot endpoints). Then use the point tool to plot a point to indicate the company's maximum output where it is producing exactly three times as many hinges as doorknobs. To refer to the graphing tutorial for this question type, please click here. Quartity ofinge 000 7500 000 4000 000 100 1000 Quartity of doorknotarrow_forward
- Assume an economy producing only two goods (shoes and computers) with a fixed amount of productive resources and technology and employing all its productive resources to the maximum.Production in this economy is subjected to the law of diminishing marginal returns and resourcesare assumed to be fully optimized. In addition, the cost of sacrificing shoes for computers andvice versa is 1. On the basis of the foregoing assumptions, answer the following questions: What happens to the PPF when technological change overwhelmingly favours the production of computers?arrow_forwardAssume an economy producing only two goods (shoes and computers) with a fixed amount of productive resources and technology and employing all its productive resources to the maximum.Production in this economy is subjected to the law of diminishing marginal returns and resourcesare assumed to be fully optimized. In addition, the cost of sacrificing shoes for computers andvice versa is 1. On the basis of the foregoing assumptions, answer the following questions: What happens to the PPF when the economy discovers an improved technology for producing shoes?arrow_forwardThe table below shows the production possibilities for Canada and Japan. Suppose that, prior to specialization and trade, both Canada and Japan are producing combination C. Product DVD players Bushels of wheat Product DVD players Bushels of wheat DVD players 100 80 60 40 20 0 20 A Canada 40 60 A 20 0 A 40 0 Quantity of wheat per period 80 B 15 20 a) Draw the production possibilities curve for Canada in the graph A, and indicate its present output position. Draw the production possibilities curve for Japan in graph B, and indicate its present output position. Plot only the endpoints of each curve in the graphing areas using the appropriate tool. Plot the output combination in each graph using the Point tool. 100 B 30 7.5 CANADA'S PRODUCTION POSSIBILITIES C 10 40 JAPAN'S PRODUCTION POSSIBILITIES с 20 15 Tools PP Curve combination D 5 Trading Possi New combina 60 D 10 22.5 E 0 80 E 0 30arrow_forward


