
Microeconomics
11th Edition
ISBN: 9781260507140
Author: David C. Colander
Publisher: McGraw Hill Education
expand_more
expand_more
format_list_bulleted
Concept explainers
Question
Chapter 2, Problem 1QE
To determine
The shift of the
Expert Solution & Answer
Explanation of Solution
The figure shows the production possibility curve.
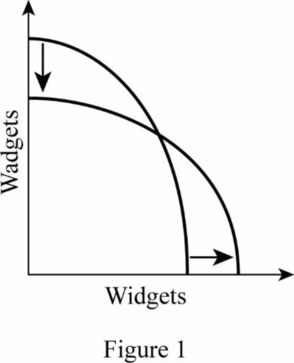
In the figure, the horizontal axis represents the production of widgets and the vertical axis represents production of wadgets. As a result of an increase in the production of widgets, the point that touches the X-axis will move rightward. If the production of wadgets decreases, the point that touches the Y-axis moves downward. This will create a new production possibility curve.
Economics Concept Introduction
Production possibility curve: Production possibility curve refers to the different combinations of two commodities that can be produced using the available resources and technologies fully and efficiently.
Want to see more full solutions like this?
Subscribe now to access step-by-step solutions to millions of textbook problems written by subject matter experts!
Students have asked these similar questions
Imagine two societies A and B with the production possibility curve shown in the diagram.
In year t Society A produces only capital goods and Society B only butter
In year t + 1 they both produce only butter.
Which of the following describes both societies in year t + 1?
A) A has a larger capital stock and A produces more butter.
B) Both have the same capital stock but A produces more butter.
C) Both have the same capital stock and both produce the same amount of butter.
D) A has a larger capital stock but B produces more butter.
Graphically show the production possibilities frontier for the nation of Stomboli, using the data given in the following table. Does the principle of increasing costs hold on Stromboli?
What ways that a country could shift its production possibilities curve to the right through improved technology.
Chapter 2 Solutions
Microeconomics
Ch. 2.1 - Prob. 1QCh. 2.1 - Prob. 2QCh. 2.1 - Prob. 3QCh. 2.1 - Prob. 4QCh. 2.1 - Prob. 5QCh. 2.1 - Prob. 6QCh. 2.1 - Prob. 7QCh. 2.1 - Prob. 8QCh. 2.1 - Prob. 9QCh. 2.1 - Prob. 10Q
Ch. 2.A - Prob. 1QECh. 2.A - Prob. 2QECh. 2.A - Prob. 3QECh. 2.A - Prob. 4QECh. 2.A - Prob. 5QECh. 2.A - Prob. 6QECh. 2.A - Prob. 7QECh. 2.A - Prob. 8QECh. 2 - Prob. 1QECh. 2 - Prob. 2QECh. 2 - Prob. 3QECh. 2 - Prob. 4QECh. 2 - Prob. 5QECh. 2 - Prob. 6QECh. 2 - Prob. 7QECh. 2 - Prob. 8QECh. 2 - Prob. 9QECh. 2 - Prob. 10QECh. 2 - Prob. 11QECh. 2 - Prob. 12QECh. 2 - Prob. 1QAPCh. 2 - Prob. 2QAPCh. 2 - Prob. 3QAPCh. 2 - Prob. 4QAPCh. 2 - Prob. 5QAPCh. 2 - Prob. 1IPCh. 2 - Prob. 2IPCh. 2 - Prob. 3IPCh. 2 - Prob. 4IPCh. 2 - Prob. 5IPCh. 2 - Prob. 6IP
Knowledge Booster


Learn more about
Need a deep-dive on the concept behind this application? Look no further. Learn more about this topic, economics and related others by exploring similar questions and additional content below.Similar questions
- How could a country shift its production possibilities curve to the right through improved technology?arrow_forwardUnder what circumstances in the Philippines can we operate outside the production possibilities curve? Explain your answer.arrow_forwardAssume China has 10,000 workers. Suppose that each Chinese worker produces either 30 pairs of boots or 10 software per month. Suppose that half of Chinese workers produce boots and half produce programs. What quantities of boots and software does China produce? Are these production combinations efficient?arrow_forward
- I've already read the answer provided on this site, but it is not giving me the information I need. I understand the math for finding the opportunity costs for each item in each country. However, where are they getting the answer that 2.5 tons of chemicals is what the US will give up, and 1 ton of apparel is what China will give up? From videos I've seen on youtube, they basically state that as long as the cost is less than what the original opportunity cost is, then nations will trade. So, it costs China 4 apparel for every 1 ton of chemicals, and in the US it costs 1 apparel for every 3 tons of chemicals. Am I right to assume that as long as China can trade less than 4 apparel it will benefit, and as long as the US can trade less than 3 tons of chemicals it will benefit? If so, then what is the math being used to arrive at exactly 1 ton of Chemicals for 1 ton of Apparel for China, and 1 apparel for 2.5 tons of Chemicals for the US? I need to understand the math that is used to…arrow_forwardASAP Consider the following PPF. PPF is linear between points A and B, B and C, C and D, D and E. What is an opportunity cost of 1c if currectly producing at c=8arrow_forwardmya and donovan produce two goods in an 8 hour day.Mya can produce 10 capital or 55 consumables and Donovan can produce 75 capital or 60 consumables. What is the opportunity cost for capital?arrow_forward
- The figure above shows a country's production possibility frontier (PPFA). В PPFA PPFB The country's PPF shifts from PPFA to PPFB, and moves from Point 'A' to Point 'B'. Which event could explain this move? O The country acquired new technology in its major industries. O The country is recovering from a recession. The country decreases its capital-to-labor ratio. O The country utilizes its excess labor. Match each letter to the input it represents. Choose ] Human capital Labor Natural capital L Animals Natural resources and labor Labor and land Land and natural resources H Physical Capital Entrepreneurship/ Automation K Choose ] A Choose ] Use the lecture video and slides to fill in the blanks.The catch-up effect is why poor countries grow faster than rich ones. This is because developing countries to make their inputs more productive; whereas developed countries must to increase growth.arrow_forwardMya and Donovan produce two goods in an 8 hour day. Mya can produce 10 capital or 55 consumables and Donovan can produce 75 capital or 60 consumables. What is the opportunity cost for capital?arrow_forwardFood 0 Alpha Shelter Beta In the figure are two linear production possibilities curves for countries Alpha and Beta. We can conclude thatarrow_forward
- Why is a production possibilities frontier typically drawn as a curve, rather than a straight line?arrow_forwardThe table below shows the production possibilities for Canada and Japan. Suppose that, prior to specialization and trade, both Canada and Japan are producing combination C. Product DVD players Bushels of wheat Product DVD players Bushels of wheat DVD players 100 80 60 40 20 0 20 A Canada 40 60 A 20 0 A 40 0 Quantity of wheat per period 80 B 15 20 a) Draw the production possibilities curve for Canada in the graph A, and indicate its present output position. Draw the production possibilities curve for Japan in graph B, and indicate its present output position. Plot only the endpoints of each curve in the graphing areas using the appropriate tool. Plot the output combination in each graph using the Point tool. 100 B 30 7.5 CANADA'S PRODUCTION POSSIBILITIES C 10 40 JAPAN'S PRODUCTION POSSIBILITIES с 20 15 Tools PP Curve combination D 5 Trading Possi New combina 60 D 10 22.5 E 0 80 E 0 30arrow_forwardJefferson Franklin 1 wheat 1/2 cotton The table above shows the number of hours required to produce one bushel of cotton and one bushel of wheat for Jefferson and Franklin. If each person specializes according to his comparative advantage(s), a mutually beneficial price ratio would be = 1 wheat= 2/3 cotton 1 wheat = 0.4 cotton Cotton (per bushel) 10 hours 12 hours 1 wheat 1/3 cotton = Wheat (per bushel) 5 hours 4 hours raarrow_forward
arrow_back_ios
SEE MORE QUESTIONS
arrow_forward_ios
Recommended textbooks for you


 Economics (MindTap Course List)EconomicsISBN:9781337617383Author:Roger A. ArnoldPublisher:Cengage Learning


Economics (MindTap Course List)
Economics
ISBN:9781337617383
Author:Roger A. Arnold
Publisher:Cengage Learning