
Foundations of Economics (8th Edition)
8th Edition
ISBN: 9780134486819
Author: Robin Bade, Michael Parkin
Publisher: PEARSON
expand_more
expand_more
format_list_bulleted
Videos
Textbook Question
thumb_up100%
Chapter 1.A, Problem 2SPP
The spreadsheet in Table 1 provides data on the U.S. economy: Column A is the year; the other columns are quantities sold in millions per year of compact discs (column B), music videos (column C), and singles downloads (column D). Use this spreadsheet to work Problems 1 and 2.
Table 1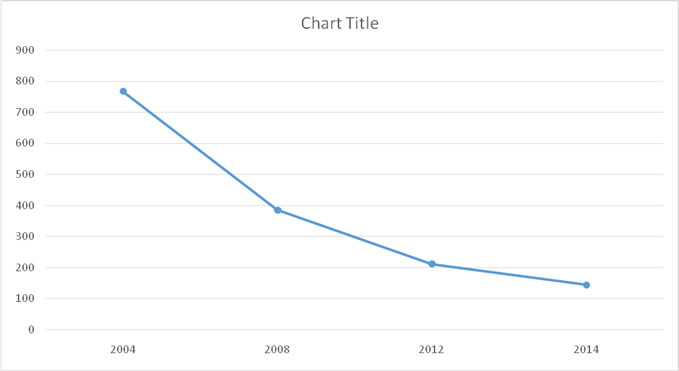
Draw a time-series graph of the quantity of compact discs sold. Say in which year or years the quantity sold (a) was highest, (b) was lowest, (c) increased the most, and (d) decreased the most.
If the data show a trend, describe it.
Expert Solution & Answer
Want to see the full answer?
Check out a sample textbook solution
Students have asked these similar questions
The following table shows data on the relationship between a worker's years of education and the salary he or she is likely to earn.
Education
Salary
(Years) (Thousands of dollars per year)
4
SALARY (Thousands of dollars per year)
Use the orange points (square symbol) to plot the data from the table on the graph below. Line segments will automatically connect the points.
50
45
8
12
40
15
25
35
Salary
Teresa
how to plot the following points?
Greenhouse gases trap heat and make the planet warmer. Human activities are responsible for
almost all of the increase in greenhouse gases in the atmosphere over the last 150 years. In this part,
you will draw two pie graphs. A pie graph is used to show how a certain quantity has been divided
into several parts, as well as to show the comparisons among these parts.
1. The data table below shows the total U.S. greenhouse gas emissions by economic sector in 2013,
in million metric tons of CO2.
On the pie graph provided, complete the graph to show the percent of greenhouse gas emissions
for each economic sector. Label each section of the pie graph with its economic sector. The
percent for "Agriculture" has been drawn and labeled for you.
Economic
Sector
Electricity
Transportation
Industry
Commercial &
Residential
Agriculture
Percent of
Greenhouse
Gas Emissions
31
27
21
12
9
80
75
70-
85
65
95
90
wlad
Percent
0
100
Agri-
culture
55
50
45
10
40
35
20
25
30
Chapter 1 Solutions
Foundations of Economics (8th Edition)
Ch. 1.A - Prob. 1SPPCh. 1.A - The spreadsheet in Table 1 provides data on the...Ch. 1.A - Prob. 3SPPCh. 1.A - Prob. 4SPPCh. 1.A - Draw a scatter diagram to show the relationship...Ch. 1.A - Draw a time-series graph of the quantity of music...Ch. 1.A - Prob. 3IAPCh. 1.A - Prob. 4IAPCh. 1.A - Prob. 5IAPCh. 1 - Prob. 1SPPA
Ch. 1 - Prob. 2SPPACh. 1 - Prob. 3SPPACh. 1 - Prob. 4SPPACh. 1 - Prob. 5SPPACh. 1 - Prob. 6SPPACh. 1 - Prob. 7SPPACh. 1 - Prob. 8SPPACh. 1 - Prob. 9SPPACh. 1 - Prob. 10SPPACh. 1 - Prob. 11SPPACh. 1 - Prob. 12SPPACh. 1 - Prob. 13SPPACh. 1 - Prob. 1IAPACh. 1 - Prob. 2IAPACh. 1 - Prob. 3IAPACh. 1 - Prob. 4IAPACh. 1 - Prob. 5IAPACh. 1 - Prob. 6IAPACh. 1 - Prob. 7IAPACh. 1 - Prob. 8IAPACh. 1 - Prob. 9IAPACh. 1 - Prob. 10IAPACh. 1 - Prob. 11IAPACh. 1 - Prob. 12IAPACh. 1 - Prob. 1MCQCh. 1 - Prob. 2MCQCh. 1 - Prob. 3MCQCh. 1 - Prob. 4MCQCh. 1 - Prob. 5MCQCh. 1 - Prob. 6MCQCh. 1 - Prob. 7MCQCh. 1 - Prob. 8MCQ
Knowledge Booster


Learn more about
Need a deep-dive on the concept behind this application? Look no further. Learn more about this topic, economics and related others by exploring similar questions and additional content below.Similar questions
- Please give a detailed solution with an explanation. For the graph make sure it is readable, visible, and make sure the movements are clear to be seen.arrow_forwardYour boss would like your help on a marketing research project she is conducting on the relationship between the price of soda and the quantity of soda demanded. She hands you the following document: Price of Soda Quantity of Soda Demanded (Dollars per can) (Billions of cans) 0.50 2,000 0.75 1,500 1.00 1,000 1.25 750 Your task is to take this and construct a graphical representation of the data. In doing so, you determine that as the price of soda rises, the quantity of soda demanded decreases. This confirms thearrow_forwardThe graph shows a relationship between two variables, x and y. What is the slope of the relationship at point A? >>> The graph will plot data needed to answer this question. The slope of the relationship at point A is >>>If the slope is negative, use a minus sign. If the slope is positive, do not use a plus sign 80- 70- 00- 50- 40 304 20 10- y 30 >>> Click on the graph to work out the answer Time Remaining: 01:00:48 Carrow_forward
- The following table shows selected data on unemployment and inflation in the United States between 1961 and 1965. Unemployment Rate Inflation Rate Year (Percent) (Percent) 1961 6.7 1.0 1962 5.5 1.0 1963 5.7 1.3 1964 5.2 1.3 1965 4.5 1.6 Plot the data for these five years on the following graph. Note: You will not be graded on how you plot the points, but plotting the points accurately on the graph will help you examine the relationship between unemployment and inflation during this period and solve the problems that follow. 4.5 4.0 Data Points 3.5 3.0 2.5 2.0 1.5 1.0 0.5 1 3 4 6 7 8 UNEMPLOYMENT RATE (Percent) INFLATION RATE (Percent)arrow_forwardThe following table presents historical unemployment and inflation data in the United States for the years 1974 through 1978. Unemployment Rate Inflation Rate Year (Percent) (Percent) 1974 5.6 11.0 1975 8.5 9.1 1976 7.7 5.8 1977 7.1 6.5 1978 6.1 7.6 Plot the data for these five years on the following graph. Note: You will not be graded on how you plot the points, but plotting the points accurately on the graph will help you examine the relationship between unemployment and inflation during this period and solve the problems that follow. INFLATION RATE (Percent) 6 5 13 12 Data Points 11 10 9 4 2 3 4 5 6 7 B 9 10 11 UNEMPLOYMENT RATE (Percent) Which of the following statements most accurately describes the relationship between inflation and unemployment in the United States during this time period? The short-run Phillips curve remained stable. The short-run Phillips curve shifted to the left after actual inflation was lower than expected. The short-run Phillips curve shifted to the right…arrow_forwardEnrollment at a community college over the last 4 years is: 1,800 (year 1), 2,300 (year 2), 3,000 (year 3), and 3,700 (year 4). Show the data on a bar graph. Let each horizontal increment represent 500 students.arrow_forward
- The graph shows a relationship between two variables, x and y What is the slope of the relationship at point A? >>> The graph will plot data needed to answer this question The slope of the relationship at point A is >>>If the slope is negative, use a minus sign. If the slope is positive, do not use a plus sign 70- 00- 50- 40- 304 20- 10- y 30 >>> Click on the graph to work out the answer Time Remaining: 01:00:48 €arrow_forwardDate January February March TESLA November December APPLE 290.14 164.17 359.2 173.82 290.25 156.94 April 252.75 148.17 May 224.47 136.3 June 297.15 162.02 July 275.61 156.74 August 265.25 137.97 September 227.54 153.09 October 194.7 147.78 123.18 129.93 122.4 134.76 MICROSOFT 296.02 306.08 275.51 269.9 255.57 279.36 260.18 232.25 231.48 254.42 239.82 239.23arrow_forwardReal-Time Data Analysis Exercise Use the links in the table below to access the data series on FRED used in this exercise*. Then use that data to answer the following questions. 1 *Real-time data provided by Federal Reserve Economic Data (FRED), Federal Reserve Bank of Saint Louis. For this exercise you will need to enter data from FRED for Gross Domestic Product (GDP) and Gross National Product (GNP). Using the data from FRED, enter the values for the third quarter of 2020 (shown as 2020 – 07 - 01 in FRED) for the following series IDs. (Enter your answers exactly as they appear on FRED.) Title Series ID Value Gross Domestic Product GDP $ billion Gross National Product GNP $ billionarrow_forward
- Ypsilanti Market Research conducted a survey to find out whether people who earn more money purchase more expensive goods. The following graph indicates the relationship between income the survey subjects earned and the price of the car that they purchased. The variable shown on the vertical axis is __________ (options: thousands of dollars per car, thousands of dollars per year, income, thousands of dollars, price, number of goods). The units for the variable on the horizontal axis are _________ (options: thousands of dollars per car, thousands of dollars per year, income, thousands of dollars, price, number of goods). There are two ways to view the information presented on the graph. First, the graph tells us the amount a person with a certain income is likely to spend on a car, and second, it tells us the probable income of a person who spent a certain amount on a car. For example, if an individual earned $50,000 last year and purchased a new car, you would expect that person to…arrow_forwardDescribe the graph and its trend.arrow_forwardThe table below is extracted from Happyland Republic, Bureau of Statistics records for 2019- 2020. Use the information in this table to answer the questions that follow. Base year 2019 Productio Items 2020 Productio Price Price n n Used cloth (units) 4,000 50.00 5,000 60.00 Components used tractor factory production (units) Cloth (units) 1,200.0 8,000 500.00 11,000 8,000 25.00 12,000 30.00 Beef gifts during cultural festival (Kg) Milk (litres) Computers (Units) Printers (Units) Raw materials for car assembling plant (Units) 1,500 2.00 1,700 3.00 5,000 2,000 500.00 500 300.00 4,500 250.00 1.30 7,000 2.50 2,500 600.00 400 355.00 4,450 300.00 i. Calculate Happyland Republic's nominal GDP, real GDP in 2020. Also, calculate the GDP deflator if 2019 is used as the base year. Show your work.arrow_forward
arrow_back_ios
SEE MORE QUESTIONS
arrow_forward_ios
Recommended textbooks for you

 Economics (MindTap Course List)EconomicsISBN:9781337617383Author:Roger A. ArnoldPublisher:Cengage Learning
Economics (MindTap Course List)
Economics
ISBN:9781337617383
Author:Roger A. Arnold
Publisher:Cengage Learning
Forecasting: Exponential Smoothing, MSE; Author: Joshua Emmanuel;https://www.youtube.com/watch?v=k_HN0wOKDd0;License: Standard Youtube License