Horngren's Financial & Managerial Accounting, The Financial Chapters (Book & Access Card)
5th Edition
ISBN: 9780134078939
Author: Tracie L. Miller-Nobles, Brenda L. Mattison, Ella Mae Matsumura
Publisher: PEARSON
expand_more
expand_more
format_list_bulleted
Videos
Textbook Question
Chapter 15, Problem 15.16E
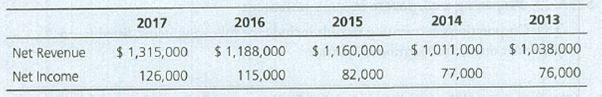
Computing trend analysis
Grand Oaks Realty's net revenue and net income for the following five-year period, using 2013 as the base year, follow:
Requirements
- 1. Compute a trend analysis for net revenue and net income. Round to the nearest full percent.
- 2. Which grew faster during the period, net revenue or net income?
Expert Solution & Answer
Want to see the full answer?
Check out a sample textbook solution
Students have asked these similar questions
Computing trend analysis
Grand Oaks Realty’s net revenue and net income for the following five—year period, using 2015 as the base year, follow:
Requirements
Compute a trend analysis for net revenue and net income. Round to the nearest full percent.
Which grew faster during the period, net revenue or net income?
Calculating trend analysis
Muscateer Corp reported the following revenues and net income amounts:
Requirements
Calculate Muscateer’s trend analysis for revenues and net income Use 2016 as the base year and round to the nearest percent.
Which measure increased at a higher rate during 2017-2019?
Use the following information to determine the Prior Year and Current Year trend percents for net sales using the Year as the base year Enter the answers thousands of dollars.
Chapter 15 Solutions
Horngren's Financial & Managerial Accounting, The Financial Chapters (Book & Access Card)
Ch. 15 - What part of the Libertys annual report is written...Ch. 15 - Horizontal analysis of Liberty's balance sheet for...Ch. 15 - Vertical analysis of Liberty's balance sheet for...Ch. 15 - Which statement best describes Liberty's acid-test...Ch. 15 - Liberty's inventory turnover during 2017 was...Ch. 15 - Prob. 6QCCh. 15 - Prob. 7QCCh. 15 - Liberty's rate of return on common stockholders'...Ch. 15 - The company has 2,500 shares of common stock...Ch. 15 - Prob. 10AQC
Ch. 15 - What ate the three main ways to analyze financial...Ch. 15 - What is an annual report? Briefly describe the key...Ch. 15 - Prob. 3RQCh. 15 - What is trend analysis, and how does it differ...Ch. 15 - Prob. 5RQCh. 15 - Prob. 6RQCh. 15 - Prob. 7RQCh. 15 - Briefly describe the ratios that can be used to...Ch. 15 - Prob. 9RQCh. 15 - Briefly describe the ratios that can be used to...Ch. 15 - Briefly describe the ratios that can be used to...Ch. 15 - Prob. 12RQCh. 15 - Prob. 13RQCh. 15 - Prob. 14RQCh. 15 - Prob. 15RQCh. 15 - Prob. 15.1SECh. 15 - Performing horizontal analysis McDonald Corp....Ch. 15 - Calculating trend analysis Variline Corp. reported...Ch. 15 - Performing vertical analysis Hoosier Optical...Ch. 15 - Preparing common-size income statement Data for...Ch. 15 - Shine's Companies, a home improvement store chain,...Ch. 15 - Shine's Companies, a home improvement store chain,...Ch. 15 - Shine's Companies, a home improvement store chain,...Ch. 15 - Prob. 15.9SECh. 15 - Prob. 15.10SECh. 15 - Prob. 15.11SECh. 15 - Using ratios to reconstruct a balance sheet...Ch. 15 - Prob. 15.13SECh. 15 - Prob. 15.14SECh. 15 - Prob. 15.15ECh. 15 - Computing trend analysis Grand Oaks Realty's net...Ch. 15 - Prob. 15.17ECh. 15 - Prob. 15.18ECh. 15 - Prob. 15.19ECh. 15 - Prob. 15.20ECh. 15 - Analyzing the ability to pay liabilities Big Bend...Ch. 15 - Analyzing profitability Varsity, Inc.s comparative...Ch. 15 - Prob. 15.23ECh. 15 - Using ratios to reconstruct a balance sheet The...Ch. 15 - Prob. 15.25ECh. 15 - Computing earnings per share Falconi Academy...Ch. 15 - Prob. 15.27APCh. 15 - Prob. 15.28APCh. 15 - Prob. 15.29APCh. 15 - Prob. 15.30APCh. 15 - Using ratios to evaluate a stock investment...Ch. 15 - Prob. 15.32APCh. 15 - Preparing an income statement The following...Ch. 15 - Computing trend analysis and return on common...Ch. 15 - Prob. 15.35BPCh. 15 - Prob. 15.36BPCh. 15 - Determining the effects of business transactions...Ch. 15 - Prob. 15.38BPCh. 15 - Prob. 15.39BPCh. 15 - Prob. 15.40BPCh. 15 - Prob. 15.41CPCh. 15 - Lance Berkman is the controller of Saturn, a dance...Ch. 15 - Prob. 15.1CTEI
Knowledge Booster


Learn more about
Need a deep-dive on the concept behind this application? Look no further. Learn more about this topic, accounting and related others by exploring similar questions and additional content below.Similar questions
- Computing trend analysis and return on common equity Net sales revenue, net income, and common stockholders’ equity for Azbel Mission Corporation, a manufacturer of contact lenses, follow for a four-year period. Requirements Compute trend analyses for each item for 2017-2019. Use 2016 as the base year, and round to the nearest whole percent. Compute the rate of return on common stockholders’ equity for 2017-2019, rounding to three decimal places.arrow_forwardCategory of industry is real estate. The analysis of Days Sales Outstanding is as follows: 2015: 254 days 2016: 338 days 2017: 332 days 2018: 169 days 2019: 81 days a. What is the simple trend analysis for that Days Sales Outstanding and why it is increasing and decreasing? b. Compare the ratio with the industry average.arrow_forwardComputing trend analysis and return on common equity Net sales revenue, net income, and common stockholders’ equity for Eyesight Mission Corporation, a manufacturer of contact lenses, follow for a four-year period. Requirements Compute trend analyses for each item for 2017-2019. Use 2016 as the base year, and round to the nearest whole percent. Compute the rate of return on common stockholders’ equity for 2017-2019, rounding to three decimal places.arrow_forward
- - Your answer is partially correct. Make a 5-year trend analysis, using 2016 as the base year, of (1) net sales and (2) net income. Comment on the significance of the trend results. (To satisfy this requirement you must access information regarding performance in prior years. This information is provided in the complete annual report available on the company's website.) (Round percentages to 0 decimal places, eg. 15% and enter amounts in millions) (1) Net sales Trend (2) Net income Trend $ $ eTextbook and Media 2020 274515 27 57411 26 % % $ $ 2019 APPLE INC. Trend Analysis of Net Sales and Net Income For the Five Years Ended 2020 2018 260174 21 55256 21 % % $ $ PRAL 265595 23 59531 30 % % $ $ 2017 229234 6 48351 6 % % $ $ 2016 215639 0 45687 0 % % Assistance Usedarrow_forwardNet sales revenue, net income, and common stockholders' equity for Eyesight Mission Corporation, a manufacturer of contact lenses, follow for a four-year period. E (Click the icon to view the net sales revenue, net income, and common equity) Read the requirements. Requirement 1. Compute trend analyses for each item for 2017-2019. Use 2016 as the base year, and round to the nearest whole percent. Begin by computing Eyesight Mission Corporation's trend analysis for net sales revenue, then compute Eyesignt Mission Corporation's trend analysis for net income and finally compute Eyesight Mission Corporation's trend analysis for com 2019 2018 2017 2016 Net Sales Revenue 766,000 708,000 644.000 664,000 Trend Percentages 115 % 107 % 97 % 100 % Net Income 60,000 $4 38,000 $ 36.000 2. 44.000 Trend Percentages 136 % 86 % 82 % 100 % Ending Common Stockholdors' Equity 368,000 352 000 $ 326,000 $ 296,000 Trend Percentages 124 % 119 % 110 100 % % OTI Requirement 2. Compute the rate of return on…arrow_forwardSelected comparative financial statements of Haroun Company follow. HAROUN COMPANY Comparative Income Statements For Years Ended December 31, 2021-2015 ($ thousands) Sales 2021 Cost of goods sold $ 1,769 1,271 2020 $ 1,549 2019 2018 2017 2016 2015 $ 1,410 $ 1,292 $ 1,206 $ 1,121 $ 919 1,034 889 778 723 676 539 Gross profit 498 515 521 514 483 445 380 Operating expenses Net income 377 295 271 200 173 171 142 $ 121 $ 220 $ 250 $ 314 $ 310 $ 274 $ 238 HAROUN COMPANY Comparative Year-End Balance Sheets December 31, 2021-2015 ($ thousands) Assets Cash Accounts receivable, net Merchandise inventory Other current assets Long-term investments Plant assets, net Total assets Liabilities and Equity 2021 2020 2019 2018 2017 2016 2015 $ 108 773 $ 142 812 $ 148 735 2,797 2,036 1,779 $ 151 564 1,499 $ 157 496 $ 155 $ 160 470 332 1,346 1,144 829 72 65 40 71 60 61 32 e B 220 220 220 220 3,422 3,409 2,982 1,683 $ 7,172 $ 6,464 $ 5,684 $ 4,188 $ 4,019 1,740 1,546 $ 3,596 $ 2,900 1,327 Current liabilities…arrow_forward
- Conduct a trend analysis (horizontal) for the company over current and last two years based on Comparative SFP. (note: see the second picture as example of horizontal analysis. The first photo is the given)arrow_forwarda. By what percentage did Mydeco’s revenues grow each year from 2013 to 2016? *Use the Data Table*arrow_forwardSolvency and profitability trend analysis Addai Company has provided the following comparative information: You have been asked to evaluate the historical performance of the company over the la.st five years. Selected industry ratios have remained relatively steady at the following levels for the last five years: Instructions 1. Prepare four line graphs with the ratio on the vertical axis and the years on the horizontal axis for the following four ratios (round to one decimal place): A. Return on total assetsB. Return on stockholders' equityC. Times interest earnedD. Ratio of liabilities to stockholders' equity Display both the company ratio and the industry benchmark on each graph. That is, each graph should have two lines. 2. Prepare an analysis of the graphs in (1).arrow_forward
- If Year 1 sales equal $750, Year 2 sales equal $1500, and Year 3 sales equal $930, the percentage to be assigned for Year 2 in a trend analysis, assuming that Year 1 is the base year, isarrow_forwardcalculate the • efficiency ratios, • liquidity ratios, • leverage ratios, and • profitability ratios for KPC Corporation for this year. Where data is available, also calculate ratios for last year. Use a 360-day year. All sales are on credit to business customers. Assume an income tax rate of 30 percent.arrow_forwardWhat is the year-over-year revenue change percent? Use the attached financial data to calculate the ratios for 2022. Round to the nearest decimal. Abercrombie & Fitch Co (ANF) Financial Data Revenues Cost of Sales Total Operating Expenses Interest Expense Income Tax Expense Diluted Weighted Shares Outstanding Cash + Equivalents Accounts Receivable Inventories Total Current Assets Total Assets Accounts Payable Total Current Liabilities Total Stockholders' Equity ANF Stock Price = $10.30 Select one O A. 5.3% B. 14.4% C. -1.4% O D. -3.5% 2022 $3,659.3 $1,545.9 $2,026.9 $28.5 $37.8 52.8 $257.3 $108.5 $742.0 $1,220.4 $2,694.0 $322.1 $935.5 $656.1 2021 $3,712.8 $1,400.8 $1,968.9 $34.1 $38.9 62.6 $823.1 $69.1 $525.9 $1,507.8 $2,939.5 $374.8 $1,015.2 $826.1arrow_forward
arrow_back_ios
SEE MORE QUESTIONS
arrow_forward_ios
Recommended textbooks for you
 Managerial AccountingAccountingISBN:9781337912020Author:Carl Warren, Ph.d. Cma William B. TaylerPublisher:South-Western College Pub
 Financial Reporting, Financial Statement Analysis...FinanceISBN:9781285190907Author:James M. Wahlen, Stephen P. Baginski, Mark BradshawPublisher:Cengage Learning
Managerial Accounting
Accounting
ISBN:9781337912020
Author:Carl Warren, Ph.d. Cma William B. Tayler
Publisher:South-Western College Pub
Financial Reporting, Financial Statement Analysis...
Finance
ISBN:9781285190907
Author:James M. Wahlen, Stephen P. Baginski, Mark Bradshaw
Publisher:Cengage Learning
Financial ratio analysis; Author: The Finance Storyteller;https://www.youtube.com/watch?v=MTq7HuvoGck;License: Standard Youtube License