Concept explainers
Videos
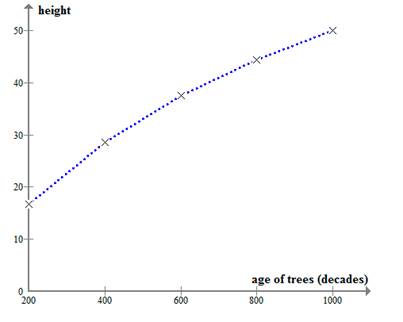
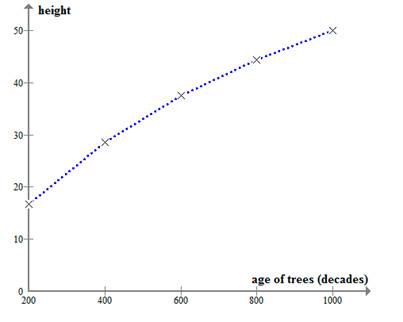
To sketch: The graph of the function by plotting the height h on the vertical axis and the age in decades on the horizontal axis.
Answer to Problem 38E
The graph of the function by plotting the height h on the vertical axis and the age in decades on the horizontal axis as given below,
Explanation of Solution
Given information:
The height of the tree
Calculation:
The height of the tree
Where a represents age of the tree in years for
Now, for
For
For
For
For
For
We can draw the graph of the function
Let
Then we have
Hence, height of the tree
For
For
For
For
For
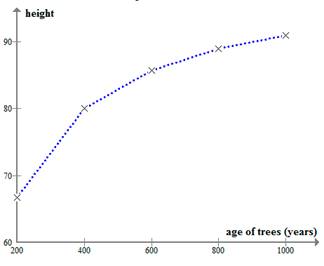
The graph of the function by plotting the height h on the vertical axis and the age in decades on the horizontal axis as given below,
Want to see more full solutions like this?
Chapter 1 Solutions
Modeling the Dynamics of Life: Calculus and Probability for Life Scientists


- Table 6 shows the year and the number ofpeople unemployed in a particular city for several years. Determine whether the trend appears linear. If so, and assuming the trend continues, in what year will the number of unemployed reach 5 people?arrow_forwardDetermine whether Table 1 could represent a function that is linear, exponential, or neither. If it appears to beexponential find a function that passes through the points.arrow_forwardIf you travel 100 miles in two hours, then your average speed for the trip is Average speed=_________=________arrow_forward
 Algebra & Trigonometry with Analytic GeometryAlgebraISBN:9781133382119Author:SwokowskiPublisher:Cengage
 Trigonometry (MindTap Course List)TrigonometryISBN:9781337278461Author:Ron LarsonPublisher:Cengage Learning
 College AlgebraAlgebraISBN:9781305115545Author:James Stewart, Lothar Redlin, Saleem WatsonPublisher:Cengage Learning
 Glencoe Algebra 1, Student Edition, 9780079039897...AlgebraISBN:9780079039897Author:CarterPublisher:McGraw Hill