
Concept explainers
Videos
a.
To calculate: The probability that the outcome will be between $16,800 and $31,200.
Introduction:
Probability:
The likelihood of the occurrence of an event or of a proposition to be true, when expressed numerically or quantitatively, is termed as probability.
a.
Answer to Problem 20P
The probability that the outcome will be between $16,800 and $31,200 is 0.8664.
Explanation of Solution
The calculation of the expected value (Z) for the outcome being equal to or greater than $16,800 is shown below.
The calculation of the expected value (Z) for the outcome being equal to or lower than $31,200 is shown below.
The Z values are positive as well as negative 1.5. Hence, the probability of the outcome being between $16,800 and $31,200 is 0.8664.
b.
To calculate: The probability that the outcome will be between $14,400 and $33,600.
Introduction:
Probability:
The likelihood of the occurrence of an event or of a proposition to be true, when expressed numerically or quantitatively, is termed as probability.
b.
Answer to Problem 20P
The probability that the outcome will be between $14,400 and $33,600 is 0.9544.
Explanation of Solution
The calculation of the expected value (Z) for the outcome being equal to or greater than $14,400 is shown below.
The calculation of the expected value (Z) for the outcome being equal to or lower than $33,600 is shown below.
The Z values are positive as well as negative 2. Hence, the probability of the outcome being between $14,400 and $33,600 is 0.9544.
c.
To calculate: The probability that the outcome will be at least $14,400.
Introduction:
Probability:
The likelihood of the occurrence of an event or of a proposition to be true, when expressed numerically or quantitatively, is termed as probability.
c.
Answer to Problem 20P
The probability that the outcome will be at least $14,400 is 0.9544.
Explanation of Solution
The calculation of the expected value (Z) for the outcome being at least $14,400 is shown below.
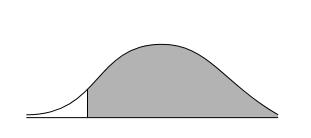
The expected value is 0.4772 when Z is (+ or -) 2 and 0.5000 when Z is 0. So, the probability of the outcome being at least $14,400 is 0.9772. The graph of this probability is shown below.
d.
To calculate: The probability that the outcome will be less than $31,900.
Introduction:
Probability:
The likelihood of the occurrence of an event or of a proposition to be true, when expressed numerically or quantitatively, is termed as probability.
d.
Answer to Problem 20P
The probability that the outcome will be less than $31,900 is 0.9544.
Explanation of Solution
The calculation of the expected value (Z) for the outcome being at least $14,400 is shown below.
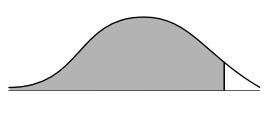
The expected value is 0.4505 when Z is (+ or -) 1.65 and 0.5000 when Z is 0. So, the probability of the outcome being at least $14,400 is 0.9505. The graph of this probability is shown below.
e.
To calculate: The probability that the outcome will be less than $19,200 or greater than $26,400.
Introduction:
Probability:
The likelihood of the occurrence of an event or of a proposition to be true, when expressed numerically or quantitatively, is termed as probability.
e.
Answer to Problem 20P
The probability that the outcome will be less than $19,200 or greater than $26,400 is 0.4672.
Explanation of Solution
The calculation of the expected value (Z) for the outcome being less than $19,200 is shown below.
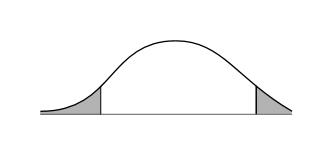
The expected value is 0.3413 when Z is (+ or -) 1 and 0.5000 when Z is 0. So, the probability of the outcome being less than $19,200 is 0.1587 (0.5000 – 0.3413).
The calculation of the expected value (Z) for the outcome being greater than $26,400 is shown below.
The expected value is 0.1915 when Z is (+ or -) 1 and 0.5000 when Z is 0. So, the probability of the outcome being at least $14,400 is 0.3085 (0.5000 – 0.1915).
Hence, the probability that the outcome will be less than $19,200 or greater than $26,400 is 0.4672. The graph of this probability is shown below.
Want to see more full solutions like this?
Chapter 13 Solutions
Loose Leaf for Foundations of Financial Management Format: Loose-leaf


- Consider the following time series: Construct a time series plot. What type of pattern exists in the data? Use simple linear regression analysis to find the parameters for the line that minimizes MSE for this time series. What is the forecast for t = 8?arrow_forwardConsider the information below, compute the expected return, variance, and standard deviation. Show the solution. Probability Return of Assets 25% .30 25% .050 25% .100 25% .280arrow_forwardConsider two assets with expected return R1=0.22,R2=0.55and variance are s1=0.80, s2=0.88 and r12=0.55 respectively.A portifolio with weights W1=0.25 and W2= 0.65 is formed calculate the expected return and variance of the portifolioarrow_forward
- uppose the average return on Asset A is 7.1 percent and the standard deviation is 8.3 percent, and the average return and standard deviation on Asset B are 4.2 percent and 3.6 percent, respectively. Further assume that the returns are normally distributed. Use the NORMDIST function in Excel® to answer the following questions. a. What is the probability that in any given year, the return on Asset A will be greater than 12 percent? Less than 0 percent? (Do not round intermediate calculations and enter your answers as a percent rounded to 2 decimal places, e.g., 32.16.) b. What is the probability that in any given year, the return on Asset B will be greater than 12 percent? Less than 0 percent? (Do not round intermediate calculations and enter your answers as a percent rounded to 2 decimal places, e.g., 32.16.) c-1. In a particular year, the return on Asset A was −4.38 percent. How likely is it that such a low return will recur at some point in the future? (Do not round…arrow_forwardThe returns on assets C and D are strongly correlated with a correlation coefficient of 0.80. The variance of returns on C is 0.0009, and the variance of returns on D is 0.0036. What is the covariance of returns on C and D? Give typing answer with explanation and conclusionarrow_forwardSuppose that the returns on an investment are normally distributed with an expected return of 16% and standard deviation of 3%. What is the likelihood of receiving a return that is equal to or less than 19%? (Hint: the area under a curve for 1 std dev is 34.13%, 2 std dev is 47.73% and 3 std dev is 49.87%.).arrow_forward
- Assume that we have three assets. The first one has expected return μ1 = 10% and standard deviation of return equal to σ1 = 0.14. The second has expected return μ2 = 20% and standard deviation of return equal to σ2 = 0.2. The third asset has expected return μ3 = 15%. We would like to determine the range of the standard deviation of the third asset so that non of the asset dominates another. This range is an interval with a lower bound a and an upper bound b. What equals the lower bound a of the interval? Please insert your result with two decimals.arrow_forwardThe variance ratio (VR) can be used to determine whether returns satisfy the efficient market hypothesis (EMH). Let n = 5 and r5,t be the five period log return at time t, where t = 1, 2,..., T. 1. Express (r5,t — Ã5) in terms of deviations of the relevant one period log returns from their respective means. Denote 75 to be the mean of the five period log return.arrow_forwarda. Using the data in the table below alculate the following performance measures.i. Sharpe ratioii. Treynor measureiii. Jensen’s alphaiv. M-squared measurev. T-squared measure, andvi. Appraisal ratio (information ratio) Fund Average return Standard Deviation Beta coefficient Unsystematic Risk A 0.240 0.220 0.800 0.017 B 0.200 0.170 0.900 0.450 C 0.290 0.380 1.200 0.074 D 0.260 0.290 1.100 0.026 E 0.180 0.400 0.900 0.121 F 0.320 0.460 1.100 0.153 G 0.250 0.190 0.700 0.120 Market 0.220 0.180 1.000 0.000 Risk free return 0.050 0.000 b. Out of the performance measures you calculated in part a., which one would you use undereach of the following circumstances:i. You want to select one of the funds as your risky portfolio.ii. You want to select one of the funds to be mixed with the rest of your portfolio,currently composed solely of holdings in the market-index fund.iii. You want to select one of the funds to form an actively managed stock portfolioarrow_forward
- Suppose the gain from an investment is a normal random variable with mean 2 and standard deviation1.25. Compute the VaR for this investment.arrow_forwardConsider two assets. Suppose that the return on asset 1 has expected value 0.05 and standard deviation 0.1 and suppose that the return on asset 2 has expected value 0.02 and standard deviation 0.05. Suppose that the asset returns have correlation 0.4.Consider a portfolio placing weight w on asset 1 and weight 1-w on asset 2; let Rp denote the return on the portfolio. Find the mean and variance of Rp as a function of w.arrow_forwardAre the following statements true or false? Provide a short justification for vour answer. а) assets A, B, C, with expected returns and standard deviations: Suppose you are a mean-variance optimizer. The risk-free rate is 3%. There are three risky E [řA] = 10%, SD [řA] = 5% E [řB] = 15%, SD [řB] = 7% E [řc] = 12%, SD [ŕc] = 9% You cannot invest in all three risky assets. Instead, you have to choose whether to invest in only assets (A, B), or only assets (A, C). Asset B mean-variance dominates asset C, since it has higher return and lower standard deviation than asset C. Thus, as long as you are risk-averse, you would always prefer the set of assets (A, B) to the set assets (A, C). b) the same market B's. The covariance matrix between A, B, C is: Suppose the CAPM holds. Consider three stocks A, B, C. Suppose that assets A, B, C have 0.05 0.03 0.03 0.05 0.05 Assets A, B, C have the same variance. However, assets A and B are positively correlated with each other, so they have larger…arrow_forward
 Essentials of Business Analytics (MindTap Course ...StatisticsISBN:9781305627734Author:Jeffrey D. Camm, James J. Cochran, Michael J. Fry, Jeffrey W. Ohlmann, David R. AndersonPublisher:Cengage Learning