
Concept explainers
a
To plot:
Graphical representation of production frontier.
a
Explanation of Solution
The utility function is given by as-
The budget line is given as:
With the help of Langraingian expression this problem can be explained as:
Taking the differentials w.r.t x,y and
Demand for x is given by:
Demand for y is given as:
His or her demand for x and y depends on relative prices of these value.
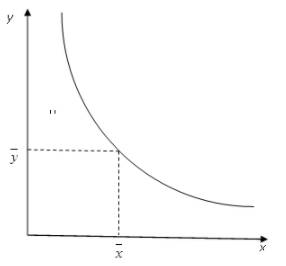
Graph 1
Introduction:
Utility is the amount of satisfaction derived for consumption of goods or services. It is usually measured in utils.
b)
To find:
Quantity of x and y to be produced.
b)
Explanation of Solution
The total available goods are 1000. From the equilibrium condition is given as-
Now put this value of x in the budget equation:
Now put this value of x in the budget equation:
Here
The total endowment is 1000. So, y = 500 and x = 500
Introduction:
Indifference curve is a curve which represents combination of goods which gives equal satisfaction.
c)
To know:
RPT and price ratio of
c)
Explanation of Solution
For this
The equation shows the pareto optimal allocation. It is given that
y = 500 and x = 500
The price ratio can be calculated as follows:
This expression shows pareto efficient condition.
Introduction:
Marginal Rate of technical substitution is the rate at which one factor of input can be substituted for another input, output remaining same. It shows efficiency of inputs for productivity.
Indifference curve is a curve which represents combination of goods which gives equal satisfaction.
d)
To find:
Price ratio and MRS.
d)
Explanation of Solution
Suppose total amount of the product be allocated between x and y with respect to x=600 and y = 400. The given utility function is given as:
So, the MRS is given as:
It is known that marginal rate of substitution is equal to price ratio = 0.67
Introduction:
Marginal Rate of technical substitution is the rate at which one factor of input can be substituted for another input, output remaining same. It shows efficiency of inputs for productivity.
Indifference curve is a curve which represents combination of goods which gives equal satisfaction.
Want to see more full solutions like this?
Chapter 13 Solutions
Microeconomic Theory


- Option Baseball Bats Tennis Racquets A 20 2 19 C 4 18 6. 16 8 10 F 10 The table above shows the production possibilities frontier for a company producing only 2 goods: baseball bats and tennis racquets. Suppose the company is currently producing 4 bats and 10 racquets all of which have been ordered by customers. If customer John puts in an order for 4 bats, so that the total number of bats to produce would then be 8, what is be the opportunity cost of filling John's order? 8 racquets 10 racquets nothing 18 racquetsarrow_forwardperson 1 can allocate her 8 hour day between the production of two goods: A and B. Each hour devoted to good B yeilds 2units . whereas each hour devoted to good A produces 4 units. state whether 9 units of good B and 12 units of good A are unattainable, efficient, or inefficient.(state all that applies) select one or more attainable inefficient efficient unattainablearrow_forwardQuestion 3 Person 1 can allocate her 8-hour day between the production of two goods A and B. Each hour devoted to Good B yields 2 units whereas each hour devoted to Good A produces 4 units. a) State whether 9units of Good B and 12 units of Good A are attainable, unattainable, efficient or inefficient. (State all that applies) b) Person 2, can produce3 units of Good B or 4 units of Good A per hour who has the absolute advantage in the production of Good B? c) who has the absolute advantage in the production of Good A? d) Calculate the opportunity cost for Good B for Person 2 e) Calculate the opportunity cost for Good A for person 1 f) who has the comparative advantage in the production of Good B? g) who has the comparative advantage in the production of Good A?arrow_forward
- Q 1) WHAT IS THE AMOUNT OF THE PRODUCER'S EXPENDITURES IN THE MARKET BELOW, GIVEN Pe and Qe YOU DEFINE? Q 2) WHAT IS THE AMOUNT OF NET BENEFITS THAT CONSUMERS EXPECT TO RECEIVE FROM CONSUMING THE FOURTH BANANA?arrow_forwardSarah and Andrew are two traders in a pure exchange economic with two goods, Bikes (B) and Computers (C). Sarah's preferences are described by the Cobb-Douglas Utility function: U, = B!³ C?3 1/3 S. Andrew's preferences are given by: UA = B}{²C}2 ´A Assume the price of Bikes is 1 and the price of computers is p. The initial endowments are BA = 10, Bs = 20, CA = 20 and Cs= 10. What is the equilibrium price of computers relative to bikes (p)? %3D %Darrow_forwardGeneral Equilibrium - End of Chapter Problem The economy of Nashville is producing both guitars and Cadillacs. The production possibilities frontier for guitars and Cadillacs is shown in the accompanying figure, along with an indifference curve showing the utility of a representative consumer. The economy is currently operating at point A, where it is both productively efficient and efficient in exchange. Cadillacs A 20 U PPF Guitars Goolsbee et al., Microeconomics, 3e, © 2020 Worth Publishers If, at A, the marginal utility of another guitar is 10, and the marginal utility of another Cadillac is 5, while the marginal product of labor in the guitar industry 10, what must the marginal product of labor be in producing Cadillacs? 25 5 10arrow_forward
- If f(k) = 6k0.5, s = 0.1, n = 0.1, and d = 0.2, what is the value of f(k) at equilibrium? A. 6 B. 12 C. 18 D. 24arrow_forward01. Suppose there is only 1 product in the economy and that's Pizza, whoever wants to pay for pizza can be able to enjoy pizza. There two people Chris and Phill. Both are willing to pay 150$ for this pizza, but with this amount Chris wants to have 2 pizzas whilst Phill wants to have 3 pizzas. Being a pizza supplier by which method you can determine their demands for pizza and how can you ensure the market equilibrium. Support your answer with graph(s).arrow_forwardConsider the diagram below. At point C, which of the following statement(s) is (are) true? The American Medical Association reported that the consumption of green peas would lower the likelihood of breast cancer. Which of the following diagrams best illustrates the impact of this medical announcement? (Note: DO is the original relationship and D1 is the new relationship.) Select one: O a. P(green peas) O b. P (green peas) O C. P (green peas) A Do Di Qmreen peas) B Q(green peas)arrow_forward
- For all questions, refer to the graph on the reverse side. Use this graph for 1 – 4. The graph represents the market for coffee. Estimation may be necessary, so show work. Name a good that will see increased sales due to the tariff or quota above. Name a good besides coffee that will see decreased sales due to the tariff or quota above. Suppose that 1 US$ = 1.5 South African Rand. Also, suppose that the representative good, peanut butter, is $3 per jar in the US and 4 Rand per jar in SA. How will this situation affect the exchange market for U.S. dollars? Explain/show the effect(s) of these prices. Include the initial effect(s), the market adjustment(s), and the final result(s) on equilibrium.arrow_forward4. Suppose the production possibility frontier for meat (M) and potatoes (P) is given by: 2P + 4M = 200 a. Suppose that people prefer to eat two potatoes with every pound of meat, how much of each product will be produced? b. Assuming that this economy is operating efficiently, what price ratio must prevail?arrow_forwardSay that Laura (L), Maureen (M), and Carrie (C) are three individuals who are contemplating the purchase of some amount of good X. Units of X can be produced at a constant marginal cost of 24. The following equations show how the marginal benefit (M B) that each individual places on X varies with the quantity she consumes: L: MB(L) = 30 - X M: MB(M) = 24 - X C: (MB(C) = 20 - X (a) How much of this good should they purchase if X is a private good? (b) How much of this good should they purchase if X is a public good? (c) Construct a diagram to illustrate your answer to part b.arrow_forward
