
Videos
Academy Awards and Movie Fan Sentiment. The race for the 2013 Academy Award for Actress in a Leading Role was extremely tight, featuring several worthy performances. The nominees were Jessica Chastain for Zero Dark Thirty, Jennifer Lawrence for Silver Linings Playbook, Emmanuelle Riva for Amour, Quvenzhané Wallis for Beasts of the Southern Wild, and Naomi Watts for The Impossible. In a survey, movie fans who had seen each of the movies for which these five actresses had been nominated were asked to select the actress who was most deserving of the 2013 Academy Award for Actress in a Leading Role. The responses follow.
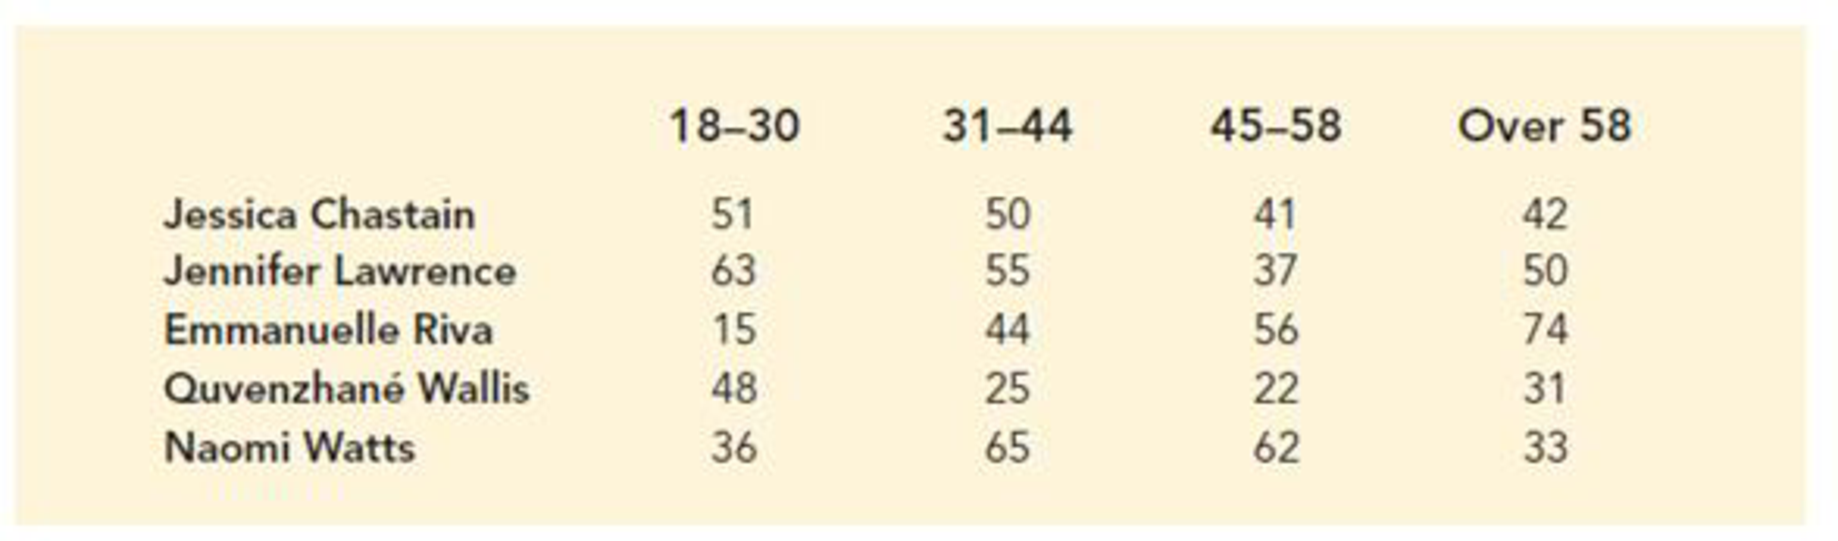
- a. How large was the sample in this survey?
- b. Jennifer Lawrence received the 2013 Academy Award for Actress in a Leading Role for her performance in Silver Linings Playbook. Did the respondents favor Ms. Lawrence?
- c. At α = .05, conduct a hypothesis test to determine whether people’s attitude toward the actress who was most deserving of the 2013 Academy Award for Actress in a Leading Role is independent of respondent age. What is your conclusion?
a.
Find the sample size for the given survey.
Answer to Problem 16E
The sample size is 900.
Explanation of Solution
Calculation:
The given observed frequency
| Actress | Age 18-30 | Age 31-44 | Age 45-58 | Age over 58 | Total |
| JC | 51 | 50 | 41 | 42 | 184 |
| JL | 63 | 55 | 37 | 50 | 205 |
| ER | 15 | 44 | 56 | 74 | 189 |
| QW | 48 | 25 | 22 | 31 | 126 |
| NW | 36 | 65 | 62 | 33 | 196 |
| Total | 213 | 239 | 218 | 230 | 900 |
Thus, the sample size is 900.
b.
Explain whether the respondents favor Ms. L.
Explanation of Solution
Calculation:
Actress JL received the 2013 Academy Award for actress in a leading role for movie “SLP”.
The sample proportion of movie fan for Actress JC is,
The sample proportion of movie fan for Actress JL is,
The sample proportion of movie fan for Actress ER is,
The sample proportion of movie fan for Actress QW is,
The sample proportion of movie fan for Actress NW is,
It is clear that, the sample proportion for Actress JL is highest. Thus, the respondents favor Ms. JL. However, Actress JC, Actress ER and Actress NW were also favored by almost same number of fans.
c.
Perform a hypothesis test to determine whether people’s attitude toward the actress who was most deserving of the 2013 Academy Award in a Leading Role, is independent of respondent age at 5% level of significance and draw conclusion of the study.
Answer to Problem 16E
The data provide sufficient evidence to conclude that people’s attitude toward the actress who was most deserving of the 2013 Academy Award in a Leading Role is not independent of respondent age.
Explanation of Solution
Calculation:
State the test hypotheses.
Null hypothesis:
That is, people’s attitude toward the actress who was most deserving of the 2013 Academy Award in a Leading Role is independent of respondent age.
Alternative hypothesis:
That is, people’s attitude toward the actress who was most deserving of the 2013 Academy Award in a Leading Role is not independent of respondent age.
The row and column totals are tabulated below:
| Actress | Age 18-30 | Age 31-44 | Age 45-58 | Age over 58 | Total |
| Actress JC | 51 | 50 | 41 | 42 | 184 |
| Actress JL | 63 | 55 | 37 | 50 | 205 |
| Actress ER | 15 | 44 | 56 | 74 | 189 |
| Actress QW | 48 | 25 | 22 | 31 | 126 |
| Actress NW | 36 | 65 | 62 | 33 | 196 |
| Totals | 213 | 239 | 218 | 230 | 900 |
The formula for expected frequency is given below:
The expected frequency for each category is calculated as follows:
| Actress | Age 18-30 | Age 31-44 | Age 45-58 | Age over 58 |
| Actress JC | ||||
| Actress JL | ||||
| Actress ER | ||||
| Actress QW | ||||
| Actress NW |
The formula for chi-square test statistic is given as,
The value of chi-square test statistic is,
Thus, the chi-square test statistic is 77.74.
Degrees of freedom:
The degrees of freedom are
In the given problem
Therefore,
Level of significance:
The given level of significance is
p-value:
Software procedure:
Step -by-step software procedure to obtain p-value using EXCEL software:
- Open an EXCEL sheet and select cell A1.
- In cell A1 enter the formula =CHISQ.DIST.RT(77.74,12).
- Press Enter.
- Output using EXCEL software is given below:
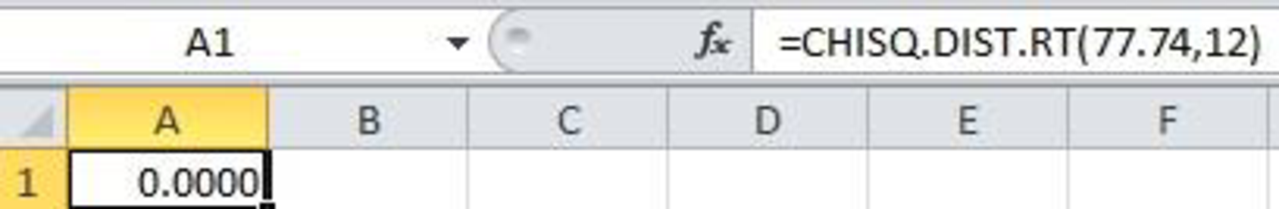
From the EXCEL output, the p-value is 0.
Rejection rule:
- If the
- Otherwise, failed to reject the null hypothesis.
Conclusion:
Here, the p-value is less than the level of significance.
That is,
Thus, the decision is “reject the null hypothesis”.
Therefore, the data provide sufficient evidence to conclude that column variable is not independent of row variable. That is, there is an association between column and row variable.
Thus, the data provide sufficient evidence to conclude that people’s attitude toward the actress who was most deserving of the 2013 Academy Award in a Leading Role is not independent of respondent age.
Want to see more full solutions like this?
Chapter 12 Solutions
Essentials Of Statistics For Business & Economics


- A poll tracks the favorite sport of Americans who follow at least one sport. Results of the poll show that professional football is the favorite sport of 33% of Americans who follow at least one sport, followed by baseball at 15%, men's college football at 10%, auto racing at 6%, men's professional basketball at 5%, and ice hockey at 5%, with other sport at 26%. Consider a survey in which 344 college undergraduates who follow at least one sport were asked to identify their favorite sport produced the following results: Professional Football 113 Baseball 38 Men's College Football 47 Auto Racing 12 Men's Professional Basketball 8 Ice Other Hockey Sports Find the p-value. (Round your answer to four decimal places.) p-value = 19 107 Do college undergraduate students differ from the general public with regard to their favorite sports? Use α = 0.05. State the null and alternative hypotheses. O Ho: Undergraduate students do not differ from the general public with regard to their favorite…arrow_forwardIndiana has a population of about 7 million people and Ohio about 12 million. Is it possible for there to be a poll where over 50% of Hoosiers say "yes", over 50% of Ohioans say "yes", but over 50% of all residents of both states say "no"? If no, explain why not. If yes, give an example of how that could happen.arrow_forwardStudies show that about 18 percent of all businesses in the United States are minority-owned.Brian lives in Centerville, a town with a population of 25,000 and 200 businesses. Assuming that the national percentage holds true for the businesses in Centerville, how many of these are minority-owned?arrow_forward
- A local country club has a membership of 600 and operates facilities that include an 18-hole championship golf course and 12 tennis courts. Before deciding whether to accept new members, the club president would like to know how many members regularly use each facility. A survey of the membership indicates that 60% regularly use the golf course, 48% regularly use the tennis courts, and 10% use neither of these facilities regularly. What percentage of the 600 use at least one of the golf or tennis facilities? Select one: A. 98% B. 90% C. 18% D. 10%arrow_forwardAn American study published in a recent year claimed to find evidence of voting by noncitizens. The conclusion was based largely on a survey several years prior in which approximately 38,000 registered voters were asked both whether they voted and whether they were citizens. A total of 339 of those surveyed reported being noncitizens, and a total of 48 of these people also said they voted. Complete parts (a) through (d) below. Based on the survey, what percentage of noncitizens claim to have voted? One difficulty with any survey is response error, in which, for example, people accidentally check the wrong box. Suppose that the response error rate for this survey was only 0.1%, meaning that 99.9% of those surveyed answered the survey questions accurately. How many people would have answered the citizenship question incorrectly? Assume that the result from part (b) represents citizens who accidentally said they were noncitizens when they were citizens, and that all these…arrow_forwardTwenty percent of the trees in a particular forest have a disease, 30% of the trees are too small to be used for lumber, and 40% are too small to be used for lumber or have a disease. What percent of the trees are too small to be used for lumber and have a disease?arrow_forward
- In 2010, the U.S. Congress passed the historic health care reform bill that will provide some type of coverage for the 32 million Americans currently without health care insurance. Just how widespread is the lack of medical coverage? The media claim that the segments of the population most at risk for disease and thus needing healthcare are women, children, the elderly and the poor. The following tables were generated from the U.S. Census Bureau, Current Population Survey, Annual Social and Economic Supplement (2011). The tables report the number of uninsured (in thousands) by sex, by age, and by household income. Is being insured or not dependent on gender? Fill in the degrees of freedom and p-value in the output below and draw a clear conclusion indicating which gender is more at risk of not being insured if there is a significant difference.arrow_forwardIn 2010, the U.S. Congress passed the historic health care reform bill that will provide some type of coverage for the 32 million Americans currently without health care insurance. Just how widespread is the lack of medical coverage? The media claim that the segments of the population most at risk for disease and thus needing healthcare are women, children, the elderly and the poor. The following tables were generated from the U.S. Census Bureau, Current Population Survey, Annual Social and Economic Supplement (2011). The tables report the number of uninsured (in thousands) by sex, by age, and by household income Is being insured or not dependent on the age groups identified in the analysis? Fill in the degrees of freedom and p-value in the output below and draw a clear conclusion indicating which age-groups are more at risk of not being insured if there is a significant relationshiparrow_forwardIn 2010, the U.S. Congress passed the historic health care reform bill that will provide some type of coverage for the 32 million Americans currently without health care insurance. Just how widespread is the lack of medical coverage? The media claim that the segments of the population most at risk for disease and thus needing healthcare are women, children, the elderly and the poor. The following tables were generated from the U.S. Census Bureau, Current Population Survey, Annual Social and Economic Supplement (2011). Explain using supportive arguments from your analyses. Write a general summary paragraph identifying groups lacking in coverage by gender, age and income and commenting on the headline. Reference the observed numbers and percentages in your summary paragraph to see how the groups trend in identifying potentially more at-risk. Analysises for reference: Is being insured or not dependent on gender? Fill in the degrees of freedom and p-value in the output below and draw…arrow_forward
- In 2010, the U.S. Congress passed the historic health care reform bill that will provide some type of coverage for the 32 million Americans currently without health care insurance. Just how widespread is the lack of medical coverage? The media claim that the segments of the population most at risk for disease and thus needing healthcare are women, children, the elderly and the poor. The following tables were generated from the U.S. Census Bureau, Current Population Survey, Annual Social and Economic Supplement (2011). The tables report the number of uninsured (in thousands) by sex, by age, and by household income Is being insured or not dependent on the income groups identified in the analysis? Fill in the degrees of freedom and p-value in the output below and draw a clear conclusion indicating which income-groups are more at risk of not being insured if there is a significant relationship.arrow_forward...... ................ ........... Before 1918, approximately 55% of the wolves in a region were male, and 45% were female. However, cattle ranchers in this area have made a determined effort to exterminate wolves. From 1918 to the present, approximately 65% of wolves in the region are male, and 35% are female. Biologists suspect that male wolves are more likely than females to return to an area where the population has been greatly reduced. (Round your answers to three decimal places.) n USE SALT (a) Before 1918, in a random sample of 10 wolves spotted in the region, what is the probability that 7 or more were male? What is the probability that 7 or more were fertale? What is the probability that fewer than 4 were female? (b) For the period from 1918 to the present, in a random sample of 10 wolves spotted in the region, what is the probability that 7 or more were male? What is the probability that 7 or more were female? What is the probability that fewer than 4 were female? Need…arrow_forwardAn addictions researcher wants to see if male and female alcoholics differ in the type of alcohol they consume. She goes to a large alcohol detox facility, gets a sample of men and a sample of women, and checks each person's chart to find the beverage of choice. She classifies the beverages as (a) wine, (b) beer, or (c) hard liquor. She then figures out how many people of this sample of 66 people fall into each category. What type of test should she perform? Answer Choices: 2-way ANOVA chi-square test of independence correlation chi-square goodness of fit Imagine an elementary school teacher who is a follower of Carl Rogers and believes that unconditional positive regard leads to psychological health and positive behaviors. He obtains a random sample of 40 children from other teachers' classrooms at his school and, through home observation, he categorizes each child as receiving unconditional positive regard frequently, sometimes, or rarely. He then has each…arrow_forward
 MATLAB: An Introduction with ApplicationsStatisticsISBN:9781119256830Author:Amos GilatPublisher:John Wiley & Sons Inc
 Probability and Statistics for Engineering and th...StatisticsISBN:9781305251809Author:Jay L. DevorePublisher:Cengage Learning
 Statistics for The Behavioral Sciences (MindTap C...StatisticsISBN:9781305504912Author:Frederick J Gravetter, Larry B. WallnauPublisher:Cengage Learning
 Elementary Statistics: Picturing the World (7th E...StatisticsISBN:9780134683416Author:Ron Larson, Betsy FarberPublisher:PEARSON
 The Basic Practice of StatisticsStatisticsISBN:9781319042578Author:David S. Moore, William I. Notz, Michael A. FlignerPublisher:W. H. Freeman
 Introduction to the Practice of StatisticsStatisticsISBN:9781319013387Author:David S. Moore, George P. McCabe, Bruce A. CraigPublisher:W. H. Freeman