
(a)
The IS and the LM equilibrium of the economy.
(a)
Explanation of Solution
The investment function of the economy is given by
The values of the C, T, I and G can be plugged into the IS equation as follows:
The money demand function of the economy is given as
The supply of real money balances can be calculated by dividing the money supply with the price level in the economy. Since the values of the two are given, the value of the supply of the real money balances can be calculated as follows:
Thus, the supply of real money balance is 3,000. The LM curve can be calculated by setting the demand equation equal to the supply equation as follows:
The IS - LM equilibrium can be calculated by equating the IS equation equal to the LM equation. Thus, the IS-LM equilibrium can be calculated as follows:
By substituting the value of r in any equation, it can provide the value of Y as follows:
Thus, the rate of interest and the Y is 10 and 5,000, respectively. These values can be illustrated at point A through the graph as follows:
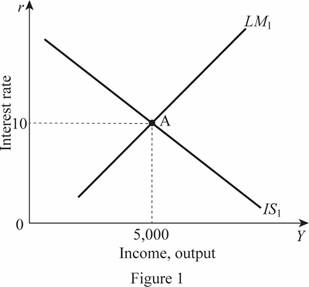
In Figure 1, horizontal axis measures the income or output and vertical axis measures the interest rate.
Fiscal policy: The fiscal policy is the policy of the government regarding the government expenditures and taxes of the economy.
(b)
The impact of tax cuts of 20 percent on the IS-LM equilibrium and the tax multiplier.
(b)
Explanation of Solution
When the tax rate decreases by 20 percent, the tax will be 800 in the economy. The IS curve will be then as follows:
The IS - LM equilibrium can be calculated by equating the IS equation equal to the LM equation. Thus, the IS-LM equilibrium can be calculated as follows:
By substituting the value of r in any equation, it can provide the value of Y as follows:
Thus, the rate of interest and the Y is 11.5 and 5,300, respectively. These values can be illustrated through the graph as follows:
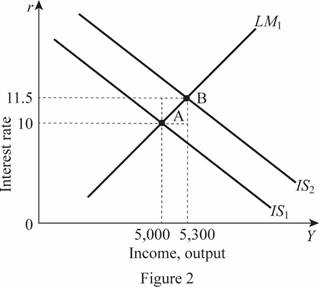
In Figure 2, horizontal axis measures the income or output and vertical axis measures the interest rate. Thus, the decrease in the tax rate by 20 percent leads to a shift in the IS curve toward the right by 300 forming a new equilibrium point B. The tax multiplier can be calculated by subtracting the change in the total output by the negative change in the taxes as follows:
Thus, the tax multiplier is -1.5.
(c)
The impact of holding the interest rate constant by Fed on Equilibrium.
(c)
Explanation of Solution
The supply of real money balances can be calculated by dividing the money supply with the price level in the economy. Since the values of the two are given, the value of the supply of the real money balances can be calculated as follows:
The LM curve can be calculated by setting the demand equation equal to the supply equation as follows:
The IS - LM equilibrium can be calculated by equating the IS equation equal to the LM equation. Thus, the rate of interest is held constant which is equal to 10 and this value can be substituted in the equilibrium equation in order to calculate the money supply as follows:
By substituting the value of r in any equation, it can provide the value of Y as follows:
Thus, the rate of interest is held constant by the fed and adjusted the money supply to 7,600. Then, the Y is calculated as 5,600. These values can be illustrated through the graph as follows:
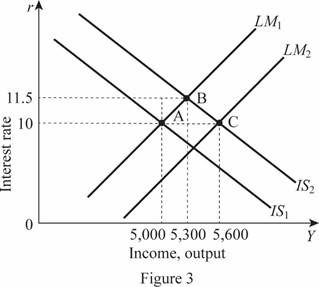
In Figure 3, horizontal axis measures the income or output and vertical axis measures the interest rate. Thus, the change leads to a shift in the LM curve toward the right by 600 by forming a new equilibrium point C. The tax multiplier can be calculated by subtracting the change in the total output by the negative change in the taxes as follows:
Thus, the tax multiplier is -3.
(d)
The impact keeping income constant through money supply on equilibrium and the tax multiplier.
(d)
Explanation of Solution
When the Fed gives importance to keep the income of the economy constant at 5,000 after the tax deduction, the value of the rate of interest can be calculated by plugging the value of the Y into the equation as follows:
Thus, the rate of interest in the economy will be then 13, which can be substituted in the LM curve to calculate the value of M as follows:
Thus, the value of M is 4,800. Thus, M decreases to 4,800 from 7,600 which means the LM curve will shift toward the left reducing the equilibrium to point D. Therefore, it can be illustrated as follows:
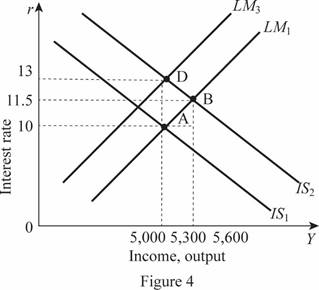
In Figure 4, horizontal axis measures the income or output and vertical axis measures the interest rate. Since the output is not changing and maintaining the same level of 5,000, there will be zero tax multiplier in the economy.
(d)
The illustration of all the equilibrium points of all the changes.
(d)
Explanation of Solution
The various IS-LM equilibrium points can be illustrated on the single graph as A, B, C, and D as follows:
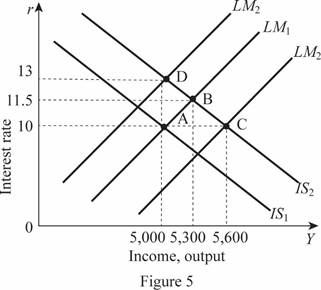
In Figure 5, horizontal axis measures the income or output and vertical axis measures the interest rate.
Want to see more full solutions like this?

- 2. An economy is initially described by the following equations: C= 600 + 0.75(Y - T) I= 1,200 – 50i M/P = Y – 200i G= 2000 %3D T= 2000 M = 4,000 P = 2 a. Derive and graph the IS curve and the LM curve. Calculate the equilibrium interest rate and level of income. Label that point A on your graph. b. Suppose that a newly elected president cuts taxes by 20 percent. Assuming the money supply is held constant, what are the new equilibrium interest rate and level of income? What is the tax multiplier? 1 c. Now assume that the central bank adjusts the money supply to hold the interest rate constant. d. What is the new level of income? What must the new money supply be? What is the tax multiplier? e. Now assume that the central bank adjusts the money supply to hold the level of income constant. What is the new equilibrium interest rate? What must the money supply be? What is the tax multiplier?arrow_forward14. An economy is initially described by the following equations: C=400+ 0.85(Y-T). I = 1000 - 40 r. (M/P)d = Y - 100r. G = 1,000. T = 1,200. M = 10,000. P = 4. a. Derive and graph the IS curve and the LM curve. Calculate the equilibrium interest rate and level of income. Label that point A on your graph. Suppose that a newly elected president cuts taxes by 25 percent. Assuming the money supply is held constant, what are the new equilibrium interest rate and level of income? What is the tax multiplier? Show your work. b. c. Now assume that the central bank adjusts the money supply to hold the interest rate constant. What is the new level of income? What must the new money supply be? What is the tax multiplier? Show your work. d. Now assume that the central bank adjusts the money supply to hold the level of income constant. What is the new equilibrium interest rate? What must the money supply be? What is the tax multiplier? Show your work. e. Show the equilibria you calculated in parts…arrow_forwardThe following equations describe an economy: C= 10 + 0.5 Y (Consumption function) I = 190-20i (Investment function) Derive the equations for IS curve and represent it graphically for i=2 and i=5arrow_forward
- Consider an economy described by the following equations. Y= C + I + GC= 100 + .75 (Y - T)I= 500 - 50rG= 125T= 100 Where: Y is GDP, C is consumption, I is investment, G is government spending, T is taxes and r is the rate of interest. Answer the questions based on the following equations above. a. What is the value of the multiplier? b. What is the equilibrium equation for Y? Show your solution. c. Suppose the Central Bank policy is to adjust the money supply to maintain the interest rate at 4 percent, so r=4. What is the value of output? Show your solution. d. Assuming that no change in fiscal policy, what is the effect of a reduction in interest rate from 4 percent to 3 percent on equilibrium output. Show your solution. e. In this case, explain the policy that was used by the policymaker to target the aggregate demand.arrow_forwardDetermine whether each of the following statements is true or false, and explain why it is true or false. Use the graph to clarify your answer. [2 x 3 marks] If the investment does not depend on the interest rate, IS curve is vertical. If there is an increase in Government expenditure IS curve will shift to the left.arrow_forwardConsider an economy with the given equations. Y=C+I+G C=106+0.6(Y−T) I=100−10r (MP)d=Y−15r G=$55 T=$35 M=$800 P=2.0 Use the relevant set of equations to derive the LM curve. Move points A and B to graph the LM curve. Calculate the equilibrium level of income (Y) and the equilibrium interest rate (r).arrow_forward
- The equilibrium position for an economy is represented by the following equations: Y = C + I, + G %3D C = a + b(Y – T) T = tY Let a = 25, b = 0.8 and t = (0.3. %3D Determine the value of the multiplier for this economy. Show your working.arrow_forwardConsider the hypothetical country of Kejimkujik. Suppose that national income in Kejimkujik is $300 billion, households pay $100 billion in taxes, household consumption is equal to $160 billion, and the marginal propensity to consume (MPC) is 0.6. On the following graph, use the blue line (circle symbol) to plot the economy's consumption function. Consumption Function050100150200250300350400450500500450400350300250200150100500CONSUMPTION (Billions of dollars)DISPOSABLE INCOME (Billions of dollars) Suppose now that Kejimkujik’s national income increases to $330 billion. Assuming the amount paid in taxes is fixed at $100 billion and that MPC = 0.6, what is the new amount of household consumption? $148 billion $219.4 billion $220.6 billion $178 billionarrow_forwardThe following equations describe an economy. Y = C + I + G. C = 120 + 0.5( Y - T ). I = 100 - 10r. G = 50. T = 40. ( M/ P) d = Y - 20r. M = 600. P = 2. What are the equilibrium level of income and the equilibrium interest rate? If the government increases government spending by 45, what will be the new equilibrium level of income and equilibrium interest rate?arrow_forward
- Suppose the United States economy is represented by the following equations: Z = C + I + G C = 500 + .5YD T = 600 I = 300 YD = Y - T G = 2000 Given the above variables, calculate the equilibrium level of output. Now, assume that government spending decreases from 2000 to 1900. What is the new equilibrium level of output? How much does income change as a result of this event? What is the multiplier for this economy?arrow_forwardThe economy is described by the following functions: C 120 + 0.8Y D Tr 15 I 50 – 5i G 80 Nx 10 Q1. Derive the IS curve • Q2. Suppose taxes in the economy go up by 5, so the new value for taxes is 10. Derive the new IS curve • Q3. Illustrate the change in the (Y, i) coordinatesarrow_forward1. Consider a model of a goods market in a closed economy that is characterized by the followingequations:Consumption : C = 160 + 0.6(Y −T )Investment : I = 150Taxes : T = 100Government spending : G = 110EQ Output : Y = 1/(1 −c1)[c0 + I + G −c1T](a) Solve for the output in the economy.(b) Compute the sum of private and public saving.(c) Considering your answer to part b and the information given above, is this economy in equilib-rium? Explain.arrow_forward
