
(a):
Cumulative distribution of income.
(a):
Explanation of Solution
The economic development is achieved when the economic price increases per head of the population in the economy. The unequal distribution of the economic price between the people in the economy causes the income inequality in the economy. The income inequality is the situation in the economy in which the major part of the income will be earned by a smaller proportion of the population and vice versa.
The cumulative share of income can be easily calculated by adding the share of income with each preceding level's cumulative share of income. Here, in this case, the percentage share of income for A for the lowest fifth is 17.7 percent. Since there are no preceding levels, the cumulative share would remain the same as 17.7 percent. The percentage share of income for the second lowest fifth is 19.9 percent. Thus, the cumulative share of the second lowest fifth will be summation of the percentage share of both lowest fifth and second lowest fifth, which can be calculated as follows:
Thus, the cumulative share of income for the second lowest fifth is calculated to be 37.6 percent. Similarly, the cumulative share of income can be calculated, and the table can be completed as follows:
| A | B | |||
| Percentage of families | Percentage share | Cumulative share | Percentage share | Cumulative share |
| Lowest fifth | 17.7% | 17.7% | 9.0% | 9.0% |
| Second lowest fifth | 19.9 | 37.6 | 14.2 | 23.2 |
| Middle fifth | 20.4 | 58.0 | 17.5 | 40.7 |
| Second highest fifth | 20.7 | 78.7 | 21.9 | 62.6 |
| Highest fifth | 21.3 | 100.0 | 37.4 | 100.0 |
Income Inequality: The income inequality is the situation where most of the
(b):
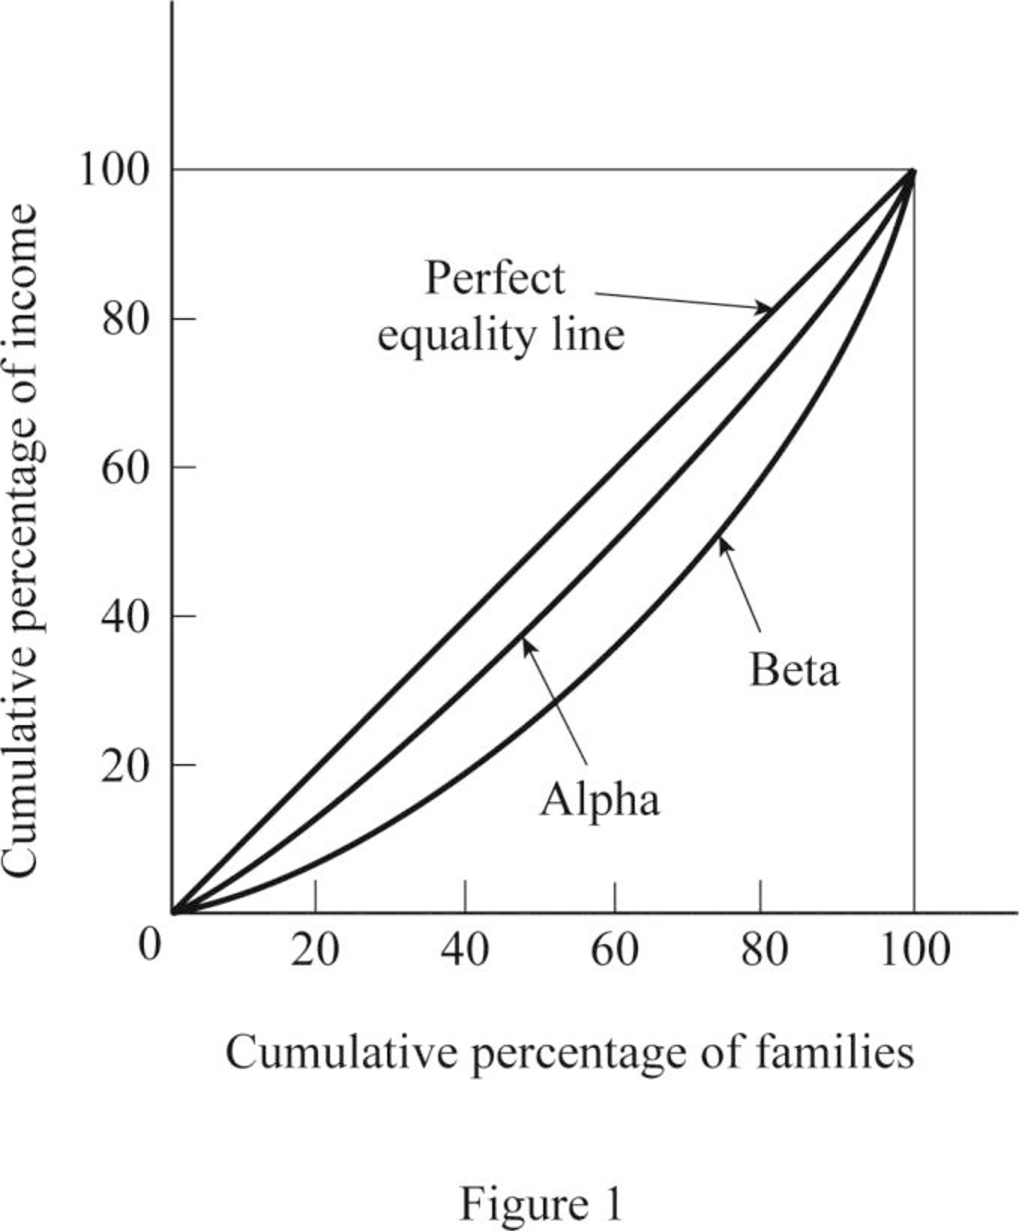
Lorenz curve of the economy.
(b):
Explanation of Solution
The Lorenz curve is the graphical illustration of the distribution of wealth in the economy. It is drawn on the cumulative percentage of income against the cumulative percentage of the population. Thus, it shows the cumulative shares of income received by the family. Thus, based on the table above, the Lorenz curve can be constructed as follows:
(c):
Country with more equal distribution of income.
(c):
Explanation of Solution
From the Lorenz curve diagram, it can be identified that the line that lies more close to the line of equality has more equal distribution of income. From the diagram, it is identified that Lorenz curve of Country A is closest to the line of equality and thus, Country A has more equal income distribution.
Want to see more full solutions like this?
Chapter 12 Solutions
Economics For Today


 Microeconomics: Private and Public Choice (MindTa...EconomicsISBN:9781305506893Author:James D. Gwartney, Richard L. Stroup, Russell S. Sobel, David A. MacphersonPublisher:Cengage Learning
 Economics: Private and Public Choice (MindTap Cou...EconomicsISBN:9781305506725Author:James D. Gwartney, Richard L. Stroup, Russell S. Sobel, David A. MacphersonPublisher:Cengage Learning
 Economics (MindTap Course List)EconomicsISBN:9781337617383Author:Roger A. ArnoldPublisher:Cengage Learning