
Statistics for Management and Economics (Book Only)
11th Edition
ISBN: 9781337296946
Author: Gerald Keller
Publisher: Cengage Learning
expand_more
expand_more
format_list_bulleted
Question
Chapter 12, Problem 136CE
To determine
Calculate the population proportion of success.
Expert Solution & Answer
Explanation of Solution
The population proportion of success (PS) is obtained using the statistical software. The result is given below:
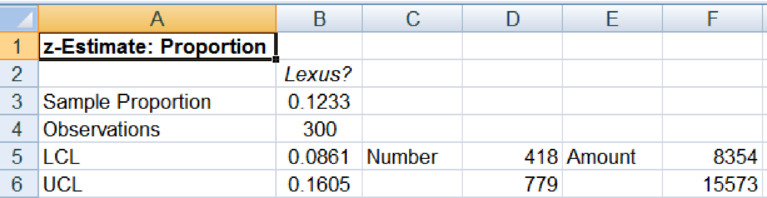
The population proportion of success lies between 0.0861 and 0.1605. The minimum amount is $8,354, and the maximum amount is $15,573.
Want to see more full solutions like this?
Subscribe now to access step-by-step solutions to millions of textbook problems written by subject matter experts!
Students have asked these similar questions
An economist collects data regarding the number of jobs an individual has held by age 21. Tim states he
had 4 jobs, Sam had 3, Jill had 3, Sally had 2, and Watney had 10.An economist should use the
to
draw conclusions. A typical individual had
jobs by the age 21.
A company launched a sales campaign and appointed 110 salesmen for this purpose. At
the end of the period the sales results were analysed and the following information was obtained.
Sales ('000
Number of Salesmen
Sales ('000-
Number of Salesmen
4
50-55
55-60
75-80
18
7
80-85
12
60-65
10
85-90
10
65-70
20
90 and above
5
70-75
22
It was decided to group the salesm
into three categories: (i) Those
whose sales were less than dollar
68,000, (ii) those whose sales were
more than Dollar 68,000, but less t
han dollar 86,000, and (iii) those w
hose sales exceeded Dollar 86,000.
The salesmen in the first category
were to be given further training an
d those in the third category to be
given efficiency bonus of 2% of thei
r sales. Find how many will be train
and how much bonus will be pai
d ? State the assumptions, if any.
OA large city hospital conducted a study to investigate the relationship between the number of unauthorized days that employees are absent per year and the
distance (miles) between home and work for the employees. A sample of 10 employees was selected and the following data were collected.
D Excel file: data14-13.xlsx
Distance to Work
Number of Days
(miles)
Absent
8.
8.
9.
8
6.
10
12
14
14
4
18
If required, enter negative values as negative numbers.
a. Select the correct scatter diagram for these data.
A.
Number of Days Absent
10+
8+ .
6-
2+
8.
10
12
14
16
18
20
Distance to Work (miles)
4.
Chapter 12 Solutions
Statistics for Management and Economics (Book Only)
Ch. 12.1 - Prob. 1ECh. 12.1 - Prob. 2ECh. 12.1 - Prob. 3ECh. 12.1 - Prob. 4ECh. 12.1 - Prob. 5ECh. 12.1 - Prob. 6ECh. 12.1 - Prob. 7ECh. 12.1 - Prob. 8ECh. 12.1 - Prob. 9ECh. 12.1 - Prob. 10E
Ch. 12.1 - Prob. 11ECh. 12.1 - Prob. 12ECh. 12.1 - Prob. 13ECh. 12.1 - Prob. 14ECh. 12.1 - Prob. 15ECh. 12.1 - Prob. 16ECh. 12.1 - Prob. 17ECh. 12.1 - Prob. 18ECh. 12.1 - Prob. 19ECh. 12.1 - Prob. 20ECh. 12.1 - Prob. 21ECh. 12.1 - Prob. 22ECh. 12.1 - Prob. 23ECh. 12.1 - Prob. 24ECh. 12.1 - Prob. 25ECh. 12.1 - Prob. 26ECh. 12.1 - Prob. 27ECh. 12.1 - Prob. 28ECh. 12.1 - Prob. 29ECh. 12.1 - Prob. 30ECh. 12.1 - Prob. 31ECh. 12.1 - Prob. 32ECh. 12.1 - Prob. 33ECh. 12.1 - Prob. 34ECh. 12.1 - Prob. 35ECh. 12.1 - Prob. 36ECh. 12.1 - Prob. 37ECh. 12.1 - Prob. 38ECh. 12.1 - Prob. 39ECh. 12.1 - Prob. 40ECh. 12.1 - Prob. 41ECh. 12.1 - Prob. 42ECh. 12.1 - Prob. 43ECh. 12.1 - Prob. 44ECh. 12.1 - Prob. 45ECh. 12.1 - Prob. 46ECh. 12.1 - Prob. 47ECh. 12.1 - Prob. 48ECh. 12.1 - Prob. 49ECh. 12.1 - Prob. 50ECh. 12.1 - Prob. 51ECh. 12.1 - Prob. 52ECh. 12.1 - Prob. 53ECh. 12.1 - Prob. 54ECh. 12.1 - Prob. 55ECh. 12.1 - Prob. 56ECh. 12.1 - Prob. 57ECh. 12.1 - Prob. 58ECh. 12.1 - Prob. 59ECh. 12.1 - Prob. 60ECh. 12.1 - Prob. 61ECh. 12.1 - Prob. 62ECh. 12.1 - Prob. 63ECh. 12.1 - Prob. 64ECh. 12.1 - Prob. 65ECh. 12.1 - Prob. 66ECh. 12.1 - Prob. 67ECh. 12.1 - Prob. 68ECh. 12.1 - Prob. 69ECh. 12.2 - Prob. 70ECh. 12.2 - Prob. 71ECh. 12.2 - Prob. 72ECh. 12.2 - Prob. 73ECh. 12.2 - Prob. 74ECh. 12.2 - Prob. 75ECh. 12.2 - Prob. 76ECh. 12.2 - Prob. 77ECh. 12.2 - Prob. 78ECh. 12.2 - Prob. 79ECh. 12.2 - Prob. 80ECh. 12.2 - Prob. 81ECh. 12.3 - Prob. 82ECh. 12.3 - Prob. 83ECh. 12.3 - Prob. 84ECh. 12.3 - Prob. 85ECh. 12.3 - Prob. 86ECh. 12.3 - Prob. 87ECh. 12.3 - Prob. 88ECh. 12.3 - Prob. 89ECh. 12.3 - Prob. 90ECh. 12.3 - Prob. 91ECh. 12.3 - Prob. 92ECh. 12.3 - Prob. 93ECh. 12.3 - Prob. 94ECh. 12.3 - Prob. 95ECh. 12.3 - Prob. 96ECh. 12.3 - Prob. 97ECh. 12.3 - Prob. 98ECh. 12.3 - Prob. 99ECh. 12.3 - Prob. 100ECh. 12.3 - Prob. 101ECh. 12.3 - Prob. 102ECh. 12.3 - Prob. 103ECh. 12.3 - Prob. 104ECh. 12.3 - Prob. 105ECh. 12.3 - Prob. 106ECh. 12.3 - Prob. 107ECh. 12.3 - Prob. 108ECh. 12.3 - Prob. 109ECh. 12.3 - Prob. 110ECh. 12.3 - Prob. 111ECh. 12.3 - Prob. 112ECh. 12.3 - Prob. 113ECh. 12.3 - Prob. 114ECh. 12.3 - Prob. 115ECh. 12.3 - Prob. 116ECh. 12.3 - Prob. 117ECh. 12.3 - Prob. 118ECh. 12.3 - Prob. 119ECh. 12.3 - Prob. 120ECh. 12.3 - Prob. 121ECh. 12.3 - Prob. 122ECh. 12.3 - Prob. 123ECh. 12.3 - Prob. 124ECh. 12.3 - Prob. 125ECh. 12.3 - Prob. 126ECh. 12.3 - Prob. 127ECh. 12.3 - Prob. 128ECh. 12.3 - Prob. 129ECh. 12.4 - Prob. 130ECh. 12.4 - Prob. 131ECh. 12.4 - Prob. 132ECh. 12.4 - Prob. 133ECh. 12.4 - Prob. 134ECh. 12.4 - Prob. 135ECh. 12 - Prob. 136CECh. 12 - Prob. 137CECh. 12 - Prob. 138CECh. 12 - Prob. 139CECh. 12 - Prob. 140CECh. 12 - Prob. 141CECh. 12 - Prob. 142CECh. 12 - Prob. 143CECh. 12 - Prob. 144CECh. 12 - Prob. 145CECh. 12 - Prob. 146CECh. 12 - Prob. 147CECh. 12 - Prob. 148CECh. 12 - Prob. 149CECh. 12 - Prob. 150CECh. 12 - Prob. 151CECh. 12 - Prob. 152CECh. 12 - Prob. 153CECh. 12 - Prob. 154CECh. 12 - Prob. 155CECh. 12 - Prob. 156CECh. 12 - Prob. 157CECh. 12 - Prob. 158CECh. 12 - Prob. 159CECh. 12 - Prob. 160CECh. 12 - Prob. 161CECh. 12 - Prob. 162CECh. 12 - Prob. 163CECh. 12 - Prob. 164CECh. 12 - Prob. 165CECh. 12 - Prob. 166CECh. 12 - Prob. 167CECh. 12 - Prob. 168CECh. 12 - Prob. 169CECh. 12 - Prob. 170CECh. 12 - Prob. 171CECh. 12 - Prob. 172CECh. 12 - Prob. 173CECh. 12 - Prob. 174CECh. 12 - Prob. 175CECh. 12 - Prob. 176CECh. 12 - Prob. 177CECh. 12 - Prob. 178CECh. 12 - Prob. 179CECh. 12 - Prob. 180CECh. 12 - Prob. 181CECh. 12 - Prob. 182CECh. 12 - Prob. 183CECh. 12 - Prob. 184CECh. 12 - Prob. 185CECh. 12 - Prob. 186CECh. 12 - Prob. 187CECh. 12 - Prob. 188CECh. 12 - Prob. 189CECh. 12 - Prob. 190CE
Knowledge Booster

Similar questions
- Note: If your answer does not exactly match the correct choice, it is due to rounding of intermediate calculations. To avoid the discrepancy, do your calculations in Excel without rounding. A life insurance company wishes to examine the relationship between the amount of life insurance held by a family and family income. From a random sample of households, the company collected the accompanying data. The data are in units of thousands of dollars. INSUR INCOME 97 38 141 29 y = X = Let INSUR 280 75 %3D INCOME 303 81 453 137 357 77 199 43 251 53 807 184 147 45 272 70 537 128 527 117 245 55 483 116 673 204 194 46 154 51 163 48 2 The denominator of the slope coefficient formula for the estimated regression equation is: 108,450.87 280 69 a 507 140 b 105,805.73 464 136 103,225.10 321 71 d 100,707.41 873 206 476 144 574 111 251 65 497 130 826 171 133 32 259 82 281 73 446 146 332 77 219 48 208 55 180 48 169 42 273 69 502 127 547 126 281 80 428 143 370 77 221 49 214 51arrow_forwardProduct Quality Value for Money Ease of use 0.8 0.6 0.7 21 0.2 0.5 0.8 3. 0.6 0.3 0.5 4 (Proposed) 0.4 0.7 0.1 Importance weight I 1.6 A company conducted a survey of shoppers to understand customer buying habits and determine the share of shoppers that a new product might attract. The customer rated three existing products and one proposed new product on three dimensions: 1.Quality, 2. Durability, and 3. Ease of use. The results of this survey are shown in the following table. The expected market share for the new proposed product (product number 4) is: (2.0) A. 46.3 В. 25.2 C. 15.1 D. 11.6 20.0 E.arrow_forwardWhy can we not use first differences when we have independent cross sections in two years (as opposed to panel data)?arrow_forward
- Many parents allow underage children to drink alcohol in limited situations when an adult is present to supervise. The idea is that teens will learn responsible drinking habits if they first experience alcohol in a controlled environment. Other parents take a strict no-drinking approach. Researchers surveyed a sample of 200 students aged 14 to 17, about their alcohol use and about alcohol related problems. Using a=0.05, answer the questions No Alcohol related Problems Alcohol Related Problems Not allowed to drink 71 9 80 Allowed to drink 89 31 |120 160 40 N=200 What is the alternative hypothesis? [ Select] What is the null hypothesis? [ Select] What inferential test is being conducted? [ Select] What is the obtained statistic? [ Select ] What determines the critical value? [ Select ] What is the critical value? [ Select ] What is the decision rule? [ Select] What is your decision? [ Select] What is your conclusion? [ Select ]arrow_forwardTextbook authors must be careful that the reading level of their book is appropriate for the target audience. Some methods of assessing reading level require estimating the average word length. We've randomly chosen 20 words from a randomly selected page in Intro Stats and counted the number of letters in each word: 5, 5, 2, 11, 3, 5, 6, 8, 5, 4, 7, 2, 9, 4, 8, 10, 4, 7, 6, 9 Suppose that our editor was hoping that the book would have a mean word length of 6.8 letters. Does this sample indicate that the authors failed to meet this goal? With a significance level of 0.05, test an appropriate hypothesis and state your conclusion. (i.e state the appropriate null and alternative hypotheses, calculate the test statistic, conclude and interpret it).arrow_forwardA publisher reports that 50%50% of their readers own a particular make of car. A marketing executive wants to test the claim that the percentage is actually different from the reported percentage. A random sample of 240240 found that 45%45% of the readers owned a particular make of car. Determine the P-value of the test statistic. Round your answer to four decimal places.arrow_forward
- What sampling technique is used? In a research class of 40 students, the teacher divides the class into five groups, each with eight members per group. The teacher then asked the class to choose their group members based on interests, compatibility, and rapport. After the selection was made, the teacher realized that the abilities per group were uneven. He then reshuffled some members of the group to achieve equilibrium among the groups. The teacher needs ten students to represent each group. He selected one male and one female from each group based on academic performance, leadership skills, and social skills as qualities that will embody as representatives per group.arrow_forwardThe birthweight (in kg) of 55 babies are tabulated in the frequency distribution below: Birthweight (kg) Class Midpoint Frequency M (1– 1.5| (1.5-2 1.25 6. 1.75 10 (2- 2.5) 2.25 1 (2.5-3) 2.75 15 10 (3-3.5] 3.25 3. (3.5- 4) 3.75 55 Total Calculate the relative frequency of the class interval (2 - 2.5).arrow_forwardA researcher investigated whether a father's level of optimism was predictive of his son's optimism as a young adult. Twenty (20) fathers and sons who agreed to participate in the study were administered a scale measuring their current level of optimism (the scale ranged from 10 to 50), with higher scores indicating greater optimism.arrow_forward
- Average prices (in dollars) were recorded for three types of beverage across all 8 major Australian states and territories. In how many states/territories is the average price of a cappuccino higher than the average price of a flat white?arrow_forwardYou must identify the relationship between housing price and size. In this experiment, you have collected data from four major cities, namely Birmingham, Manchester, Bristol and Glasgow. What method is suitable for studying this project? Give an explanation.arrow_forwardA company is considering an organizational change which entails adopting the use of self-managed work teams which they hope will lead to higher levels of employee satisfaction. In order to assess the attitudes of employees of the company towards this change a sample of 250 employees was selected and asked whether they favor the institution of self-managed teams. Three responses were allowed: favor, neutral or oppose. The observed frequency of the results of the survey are shown below: Opinion Type of Job Favor Neutral Oppose Total Hourly Worker 25 40 35 100 Supervision 45 35 20 100 Manager 20 15 15 50 Total 90 90 70 250 Use this data to test the hypothesis that opinion and type of job are independent at the .025 level.arrow_forward
arrow_back_ios
SEE MORE QUESTIONS
arrow_forward_ios
Recommended textbooks for you

 Principles of Economics (12th Edition)EconomicsISBN:9780134078779Author:Karl E. Case, Ray C. Fair, Sharon E. OsterPublisher:PEARSON
 Engineering Economy (17th Edition)EconomicsISBN:9780134870069Author:William G. Sullivan, Elin M. Wicks, C. Patrick KoellingPublisher:PEARSON
 Principles of Economics (MindTap Course List)EconomicsISBN:9781305585126Author:N. Gregory MankiwPublisher:Cengage Learning
 Managerial Economics: A Problem Solving ApproachEconomicsISBN:9781337106665Author:Luke M. Froeb, Brian T. McCann, Michael R. Ward, Mike ShorPublisher:Cengage Learning
 Managerial Economics & Business Strategy (Mcgraw-...EconomicsISBN:9781259290619Author:Michael Baye, Jeff PrincePublisher:McGraw-Hill Education
Principles of Economics (12th Edition)
Economics
ISBN:9780134078779
Author:Karl E. Case, Ray C. Fair, Sharon E. Oster
Publisher:PEARSON
Engineering Economy (17th Edition)
Economics
ISBN:9780134870069
Author:William G. Sullivan, Elin M. Wicks, C. Patrick Koelling
Publisher:PEARSON
Principles of Economics (MindTap Course List)
Economics
ISBN:9781305585126
Author:N. Gregory Mankiw
Publisher:Cengage Learning
Managerial Economics: A Problem Solving Approach
Economics
ISBN:9781337106665
Author:Luke M. Froeb, Brian T. McCann, Michael R. Ward, Mike Shor
Publisher:Cengage Learning
Managerial Economics & Business Strategy (Mcgraw-...
Economics
ISBN:9781259290619
Author:Michael Baye, Jeff Prince
Publisher:McGraw-Hill Education