
To ascertain:The necessity of general equilibrium analysis if there is an alteration in prices of goods by using mentioned diagram.
Answer to Problem 1RQ
Using the general equilibrium analysis will express more than the simple supply-
Explanation of Solution
The rise in demand will increase a goodprice, and the decline in demand will reduce it.This can beassumed from partial equilibrium analysis,but this is not sufficient to understand theworkings of the economy.Various markets are interconnected, and theyperform and respond in suchways that they influence each other. Rise in demand for a product will raise price, but itsinfluence may be different through the collaboration with other factors influencing the price of theproduct.The rise in demand calls for an increase in labour in industry. Increased labour demands morewages. It raises the cost of manufacture and production declines. Prices increase further andsupply comes down.Such interconnected influences can be analysed with the help of generalequilibrium analysis.Perfect competition brings about equilibrium in the market.Arbitrarily determined price andquantity move toward
The diagram is given below:
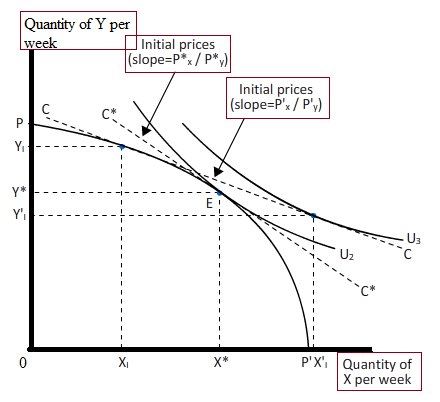
Excess demand has been shown by the difference between X’1, and X1. This excess demand willput upward pressure on the price of good X. If it would have been partial equilibrium analysis,this would have sufficed. However, in general, equilibrium analysis, along with excess demand forgood X, there will also be an
The excess supply is shown by thedifference between Y, and Y'1. This excess supply will put downward pressure on the price of goodY. The combined effect of this can be traced by clockwise rotation of the budget constraint. Thenew budget constraint C*C* is steeper than the old budget constraint CC. The steepness ofthe budget constraint C*C* indicates that price of good X has increased and price of good Yhas fallen.Hence, the new equilibrium is designated by point E which is arrived at by the interaction ofthe purchasers and the suppliers in the general equilibrium set up.
The new equilibrium, E, is theefficiency point where society's welfare is increased if
But, in an integrated market set upwhich reflects more real world this will not suffice. The necessity is to apply general equilibriumanalysis to check changes in demand tocalculate efficient outcomes that increasethe welfare of society.
Introduction: General equilibrium analysis is referring to the equilibrium of complete organisation in the economy purchaser, manufacture, resource owner, services and industries.General equilibrium succeeds when both good and factor markets are in equilibrium in relation to each other.
Want to see more full solutions like this?
Chapter 10 Solutions
EBK INTERMEDIATE MICROECONOMICS AND ITS

- How will each of the following changes in demand and/or supply affect equilibrium price and equilibrium quantity in a competitive market; that is do price and quantity rise, fall, remain unchanged, or are the answers indeterminate because they depend on the magnitudes of the shifts? Use supply and demand diagrams to verify your answers on the graph provided below. Label all axis including demand and supply. (See PPT slides #3-56, #3-58~#3-60, how to do it.) 15. a. Supply decreases and demand is constant. EI provide as an example for you to solve others. P S' Conclusion from D constant & SJ: S e2 Pe2- Price increases (P↑), and Quantity may decrease (QJ). e1 Pel Qe2 Qel b. Supply increases and demand decreases, simultaneously. E Now you provide D & S graphs. S Conclusion from DJ & S↑: Price (Р ), and Pe Quantity (Q_). e So (price, quantity) is indeterminate. Qe с. Demand increases and supply decreases, simultaneously. S Conclusion from D↑ & S]: Price (Р ), and Quantity (Q_). Pe e So…arrow_forwardWhy an equilibrium is defined as a price?arrow_forward1. A) Suppose that the demand for milk increases because a new beauty treatment is discovered that uses milk. Analyze the effects of this change on the equilibrium for milk and the equilibrium for cookies by thinking about the diagrams. B) Now to convince yourself that your graphical answer is right, consider the following supply and demand equations for milk and cookies. Qd M = 40 – 2PM – PC Qd C = 40 – 2PC – PM Qs M = PM Qs C = PC i) Solve for the equilibrium prices and quantities. ii) Now suppose that the demand for milk increases so that the demand for milk is given by Qd M= 80 – 2PM – PC. Solve for the new equilibrium prices and quantities of milk and cookies.arrow_forward
- Define an equilibrium.arrow_forwardSuppose that in 2007 Ford sold 500,000 Mustangs at an average price of $18,800 per car; in 2008, 600,000 Mustangs were sold at an average price of $19,500 per car. From these statements what changes in supply or demand on the market for Mustangs produced such changes in equilibrium? (One graph. Start by plotting two points (price versus quantity, shift either supply or demand, not both) and then draw supply and demand graphs through them in a way that explains the change in the equilibrium from 2007 to 2008.arrow_forwardSuppose that Bob and Cho represent the only two consumers of laundry detergent in some hypothetical market. The following table presents their annual demand schedules for laundry detergent: Price (Dollars per bottle) 2 PRICE (Dollars per bottle) 12 10 0 4 On the following graph, plot Bob's demand for laundry detergent using the green points (triangle symbol). Next, plot Cho's demand for laundry detergent using the purple points (diamond symbol). Finally, plot the market demand for laundry detergent using the blue points (circle symbol). Note: Line segments will automatically connect the points. Remember to plot from left to right. 0 6 8 10 8 Bob's Quantity Demanded Cho's Quantity Demanded (Bottles) (Bottles) 16 32 8 24 4 16 2 8 0 4 16 24 32 QUANTITY (Bottles) 40 48 Bob's Demand Cho's Demand Market Demand (?)arrow_forward
- The figure depicts the market for shoes. Suppose that a less expensive material for making shoes is developed. What effect will this event have on supply and demand in the shoe market? Demonstrate your answer graphically. Instructions: Use the tool provided "New line" to draw either a new demand or supply curve that reflects the market effect of this event. Plot only the endpoints of the line. if a less expensive material developed, the- will-. This will cause the equilibrium price to- and the equilibrium- quantity to-arrow_forwardYou are advising Roy on the opening of his Original-Original Famous Pizzeria. By plotting the points below on a coordinate plane, you can show Roy the price points that would lead to a shortage of slices, a surplus of slices, and the point of maximum efficiency per slice. On the graph paper below: label your vertical axis with prices and your horizontal axis with quantity, plot each point of the demand and draw the curve with one color. plot each point of supply and draw the curve with a different color, identify the equilibrium point on your grapharrow_forwardConsider the market for gasoline that is initially in equilibrium. Suppose that the Middle East, a major supplier of petroleum used to produce gasoline, erupts into war. At the same time suppose that the price of electric vehicles falls. Given these changes and holding everything else constant, what happens to the equilibrium price and quantity in the market for gasoline relative to the initial equilibrium price and quantity in the market a. The equilibrium price may increase, decrease or remain the same while the equilibrium quantity will decrease b. The equilibrium price may increase, decrease or remain the same while the equilibrium quantity willincrease c. The equilibrium price will increase while the equilibrium quantity may increase, decrease or remain the same d. The equilibrium price will decrease while the equilibrium quantity may increase, decrease or remain the samarrow_forward
- Suppose that the demand and supply of liter of petrol are given in table 1 as per attachment What is the equilibrium price and quantity of petrol? Use a graph paper to draw a demand curve and supply curve based on the table above. Now suppose that a political crisis in the Middle East lead to a decrease in the supply of petrol by 8 liter per day at every price. Show the change in the graph paper and show the new equilibrium position. What is the new equilibrium price of petrol? What is the new equilibrium quantity of petrol? In order t o help the consumer, the government imposes a price control of RM0.60 per liter: Give the name of this price control. How much petrol will be demanded by consumer at this price?. How much petrol will be offered for sale by…arrow_forwardtrue or false - explain in short be supported with an economic model. If the demand for and supply of a product both increases, the equilibrium quantity of the product must also increase. If the demand for a product decreases and the supply of the product increases, the equilibrium price of the product may increase or decrease, depending on whether supply or demand has shifted more. Assume that there is a fixed supply in the market. A higher price will result from a change in demand brought about by a rise in income.arrow_forwardSuppose that Felix and Janet represent the only two consumers of laundry detergent in some hypothetical market. The following table presents their annual demand schedules for laundry detergent: Price (Dollars per bottle) 2 4 PRICE (Dollars per bottle) 12 10 On the following graph, plot Felix's demand for laundry detergent using the green points (triangle symbol). Next, plot Janet's demand for laundry detergent using the purple points (diamond symbol). Finally, plot the market demand for laundry detergent using the blue points (circle symbol). 2 6 Note: Line segments will automatically connect the points. Remember to plot from left to right. 0 8 10 0 Felix's Quantity Demanded Janet's Quantity Demanded (Bottles) 16 (Bottles) 24 10 16 12 8 4 8 16 6 2 0 24 32 QUANTITY (Bottles) 40 48 A Felix's Demand Janet's Demand Market Demand (?)arrow_forward
 Exploring EconomicsEconomicsISBN:9781544336329Author:Robert L. SextonPublisher:SAGE Publications, Inc