
Concept explainers
Videos
a.
Construct a time series plot for temperature using the given data.
Comment on the pattern of obtained time series plot.
a.
Answer to Problem 82SE
Output obtained from MINITAB is given below:
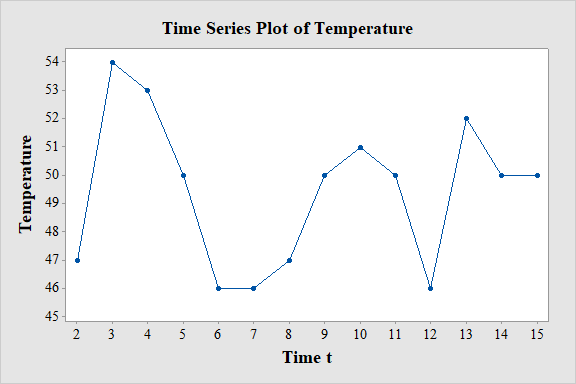
The obtained time series plot represents a cyclic pattern of temperature.
Explanation of Solution
Given info:
The data represents the observed value of response variable x at time t. The observed values are
Calculation:
Software Procedure:
Step-by-step procedure to draw the time series plot for temperature using the MINITAB software:
- Choose Graph > Time Series Plot.
- Choose Simple, and then click OK.
- In Series, enter the column of Temperature.
- Click OK.
Observation:
Time series plot shows that the highest temperature is at time 3 and the lowest temperature is at time 6 and 7. From the graph it can be concluded that temperature oscillates with the change in time. Overall the plot represents a cyclic pattern of temperature.
b.
Find the smoothed value
b.
Answer to Problem 82SE
Smoothed values
| Time t | ||
| 2 | 47 | 47 |
| 3 | 54 | 47.7 |
| 4 | 53 | 48.2 |
| 5 | 50 | 48.4 |
| 6 | 46 | 48.2 |
| 7 | 46 | 48 |
| 8 | 47 | 47.9 |
| 9 | 50 | 48.1 |
| 10 | 51 | 48.4 |
| 11 | 50 | 48.5 |
| 12 | 46 | 48.3 |
| 13 | 52 | 48.6 |
| 14 | 50 | 48.8 |
| 15 | 50 | 48.9 |
Smoothed values
| Time t | ||
| 2 | 47 | 47 |
| 3 | 54 | 50.5 |
| 4 | 53 | 51.8 |
| 5 | 50 | 50.9 |
| 6 | 46 | 48.4 |
| 7 | 46 | 47.2 |
| 8 | 47 | 47.1 |
| 9 | 50 | 48.6 |
| 10 | 51 | 49.8 |
| 11 | 50 | 49.9 |
| 12 | 46 | 47.9 |
| 13 | 52 | 50 |
| 14 | 50 | 50 |
| 15 | 50 | 50 |
Explanation of Solution
Calculation:
The exponential smoothing equation is
Smoothed values
Here, to calculate the smoothed value
That is,
Moreover, it is given that
Hence, the smoothed value
Thus, the smoothed value at time 2 is
The smoothed value
Thus, the smoothed value at time 3 is
Similarly, smoothed values for the remaining times are given below:
| Time t | ||
| 2 | 47 | 47 |
| 3 | 54 | 47.7 |
| 4 | 53 | 48.2 |
| 5 | 50 | 48.4 |
| 6 | 46 | 48.2 |
| 7 | 46 | 48 |
| 8 | 47 | 47.9 |
| 9 | 50 | 48.1 |
| 10 | 51 | 48.4 |
| 11 | 50 | 48.5 |
| 12 | 46 | 48.3 |
| 13 | 52 | 48.6 |
| 14 | 50 | 48.8 |
| 15 | 50 | 48.9 |
Smoothed values
Here, to calculate the smoothed value
That is,
Moreover, it is given that
Hence, the smoothed value
Thus, the smoothed value at time 2 is
The smoothed value
Thus, the smoothed value at time 3 is
Similarly, smoothed values for the remaining times are given below:
| Time t | ||
| 2 | 47 | 47 |
| 3 | 54 | 50.5 |
| 4 | 53 | 51.8 |
| 5 | 50 | 50.9 |
| 6 | 46 | 48.4 |
| 7 | 46 | 47.2 |
| 8 | 47 | 47.1 |
| 9 | 50 | 48.6 |
| 10 | 51 | 49.8 |
| 11 | 50 | 49.9 |
| 12 | 46 | 47.9 |
| 13 | 52 | 50 |
| 14 | 50 | 50 |
| 15 | 50 | 50 |
c.
Find the number of values of
Find the change in the coefficient of
c.
Answer to Problem 82SE
The value of
The coefficient on
Explanation of Solution
Calculation:
The exponential smoothing equation is
Substituting the value,
Substituting the value,
Continuing the same computational procedure till the value of
Now, the equation reduces as follows:
The value of
Now, the exponential smoothing equation
Here, from the above obtained equation it is seen that the value of
Here, form the equation it can be said that the coefficient of
Moreover, the smoothing constant
That is,
Hence the value of
Therefore, the coefficient on
c.
Explain the sensitivity of the initialization of
c.
Answer to Problem 82SE
The smoothed series
Explanation of Solution
Calculation:
From part (c), the exponential smoothing equation is,
The substitution of of
Here, form the equation it can be said that the coefficient of
Moreover, the smoothing constant
That is,
Hence the value of
Therefore, the smoothed series
Want to see more full solutions like this?
Chapter 1 Solutions
EBK PROBABILITY AND STATISTICS FOR ENGI


- What does the y -intercept on the graph of a logistic equation correspond to for a population modeled by that equation?arrow_forwardRepeat Example 5 when microphone A receives the sound 4 seconds before microphone B.arrow_forwardThe US. import of wine (in hectoliters) for several years is given in Table 5. Determine whether the trend appearslinear. Ifso, and assuming the trend continues, in what year will imports exceed 12,000 hectoliters?arrow_forward
- Table 6 shows the year and the number ofpeople unemployed in a particular city for several years. Determine whether the trend appears linear. If so, and assuming the trend continues, in what year will the number of unemployed reach 5 people?arrow_forwardTable 2 shows a recent graduate’s credit card balance each month after graduation. a. Use exponential regression to fit a model to these data. b. If spending continues at this rate, what will the graduate’s credit card debt be one year after graduating?arrow_forward

 Functions and Change: A Modeling Approach to Coll...AlgebraISBN:9781337111348Author:Bruce Crauder, Benny Evans, Alan NoellPublisher:Cengage Learning
 Linear Algebra: A Modern IntroductionAlgebraISBN:9781285463247Author:David PoolePublisher:Cengage Learning
 College AlgebraAlgebraISBN:9781305115545Author:James Stewart, Lothar Redlin, Saleem WatsonPublisher:Cengage Learning
 Calculus For The Life SciencesCalculusISBN:9780321964038Author:GREENWELL, Raymond N., RITCHEY, Nathan P., Lial, Margaret L.Publisher:Pearson Addison Wesley,
 Algebra & Trigonometry with Analytic GeometryAlgebraISBN:9781133382119Author:SwokowskiPublisher:Cengage