
Biology Today and Tomorrow without Physiology (MindTap Course List)
5th Edition
ISBN: 9781305117396
Author: Cecie Starr, Christine Evers, Lisa Starr
Publisher: Cengage Learning
expand_more
expand_more
format_list_bulleted
Videos
Textbook Question
Chapter 1, Problem 3FIO
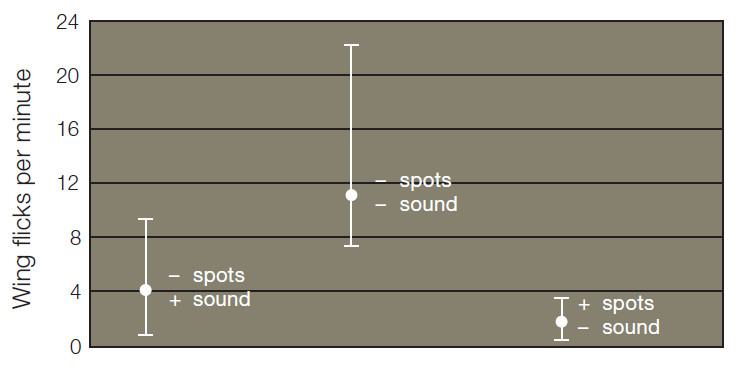
Figure 1.15 Example of error bars in a graph.
This graph was adapted from the peacock butterfly research described in Section 1.5.
The researchers recorded the number of times each butterfly flicked its wings in response to an attack by a bird.
The squares represent average frequency of wing flicking for each sample set of butterflies. The error bars that extend above and below the dots indicate the range of values—the sampling error.
Figure It Out: What was the fastest rate at which a butterfly with no spots or sound flicked its wings?
Expert Solution & Answer
Want to see the full answer?
Check out a sample textbook solution
Students have asked these similar questions
In a population of 500 fruit flies, 250 are genotype RR, 100 are genotype Rr and 150 are genotype rr. Determine the allele frequencies for this gene in this population. Remember that the frequencies should add to 1. Please show your work.
WRITE DOWN SOME NOTES OR TAKE AWAYS ABOUT THIS MODEL.
Model 3 – Random Genetic Drift
This model is an adaptation of the classic experiment conducted by Peter Buri (1956), which documented genetic drift in laboratory populations of Drosophila. In the model, ten vials (populations) of flies are held at a constant population size and the proportions of a mutant allele are tracked over generations. The population size and the initial allele proportion can be manipulated.
Can you please explain the information in this slide and help answer the blue questions?
Thank You!!
Chapter 1 Solutions
Biology Today and Tomorrow without Physiology (MindTap Course List)
Ch. 1 - Figure 1.7 Taxonomic classification of five...Ch. 1 - D. The researchers painted out the spots of some...Ch. 1 - Figure 1.15 Example of error bars in a graph. This...Ch. 1 - Prob. 1DIDCh. 1 - Prob. 1SQCh. 1 - Prob. 2SQCh. 1 - ______ is the transmission of DNA to offspring. a....Ch. 1 - A process by which an organism produces offspring...Ch. 1 - Prob. 5SQCh. 1 - ____________ move around for at least part of...
Ch. 1 - Prob. 7SQCh. 1 - DNA _______. a. guides form b. is the basis of...Ch. 1 - butterfly is a(n) _____ (choose all that apply)....Ch. 1 - A bacterium is _____ (choose all that apply). a....Ch. 1 - Bacteria, Archaea, and Eukarya are three _____.Ch. 1 - A control group is ______. a. a set of individuals...Ch. 1 - Prob. 13SQCh. 1 - Match the terms with the most suitable...Ch. 1 - In one survey, fifteen randomly selected students...Ch. 1 - A person is declared to be dead upon the...Ch. 1 - Prob. 2CTCh. 1 - Why would you think twice about ordering from a...Ch. 1 - Once there was a highly intelligent turkey that...Ch. 1 - In 2005, researcher Woo-suk Hwang reported that he...
Knowledge Booster


Learn more about
Need a deep-dive on the concept behind this application? Look no further. Learn more about this topic, biology and related others by exploring similar questions and additional content below.Similar questions
- Draw a Lineweaver-Burk plot for these data. Put both sets of data on the one graph, use a different symbol of each plot and indicate which set of data is which. Add a line of best fit (trend line) for each set of data. Indicate the values of the Y-intercept(s) and the X-intercept(s). Make sure your graph has appropriate axis labels and units.arrow_forwardWhat would happen to the relative frequencies of moth colors if environmental laws curtailed pollution and the tree bark went back to the pre-industrial color? Question 8 options: The ratio of light to dark-colored moths would stay the same. Eventually, there would be relatively more dark-colored moths. Eventually there would be relatively more light-colored moths.arrow_forwardMake a rough graph (don’t worry about exact accuracy, only the general trends are important) to visuallyrepresent the data provided. You should focus on seeing the trend. Keep the same scaled axes for all yourgraphs, as the three graphs should line up and match up with each other. Your data (plot) points don’t needto be perfectly accurate (remember, you want to visually show the general trends). LH and FSH go on the top graph, estrogen and progesterone in the middle, and endometrium thickness on the bottom graph. * Make sure you use 2 different colours for FSH/LH and estrogen/progesterone. - Now, refer to the data (and graphs). On what day(s) does the hormone LH surge? Suggest a possible function of LH and how you know this based on the data that you graphed.arrow_forward
- In a controlled experiment all of the variables are kept the same in order to contsistent. there is only one variable there is change for these kind of studies and it is known as variablearrow_forwardSquirrels can be pests at bird feeders, stealing seeds away from the intended guests. The graph below shows the results of an experiment testing a new product "Squirrel Away." On Day 1, "Squirrel-Away" was sprayed near one bird feeder. An area around a second bird feeder in a different area was NOT sprayed with "Squirrel Away." Both bird feeders contained the same seeds. The Effect of "Squirrel Away" on the Number of Squirrles at Two Bird Feeders 10 Without Squirrel Away WITH Squirrel-Away What was the independent variable in the experiment above? Average number of squirrels at the bird feeder per day Average number of birds at the bird feeder per day O Presence or absence of Squirrel Away Distance from the bird feeder that Squirrel Away was sprayed The type of seeds added to the bird feeder 9, 4. 2. at the Bird Feeder Per Day Average Number of Squirrelsarrow_forwardSome types of mosquitoes are known to use landmarks as a mechanism to find the nesting sites. If a researcher were to move the landmark away from the nest (but the nurse remains on moved in the same location), with the mosquitoes still be able to find the nesting site?arrow_forward
- Give typing answer with explanation and conclusion Why is it important to do more than one capture and release when doing population sampling studies?arrow_forwardThe following experiment is used for the following question. A researcher discovered a species of moth that lays its eggs on oak trees. Eggs are laid at two distinct times of the year: early in spring when the oak trees are flowering and in midsummer when flowering is past. Caterpillars from eggs that hatch in spring feed on oak flowers and look like oak flowers, but caterpillars that hatch in summer feed on oak leaves and look like oak twigs. How does the same population of moths produce such different-looking caterpillars on the same trees? To answer this question, the biologist caught many female moths from the same population and collected their eggs. He put at least one egg from each female into eight identical cups. The eggs hatched, and at least two larvae from each female were maintained in one of the four temperature and light conditions listed below. Temperature Springlike Springlike Summerlike Summerlike Day Length Springlike Summerlike springlike summerlike In each of the…arrow_forwardExperimental data Below are three different experiments with data in table form. Read the paragraph describing each data set, and state a hypothesis before looking at the actual Look at the data and determine the independent and dependent Graph each set of data using the appropriate type of graph (bar graph, line graph, scatter graph, pie chart) following the information from the Graphing Guidelines and Graphing Rules Be sure to specify units on both axes Calculate appropriate divisions to maximize the use of the entire graph Give your graph an appropriate title Four pages of graph paper are included in this Graph each set of data on a separate graph so you can maximize your graph size (one extra graph paper is included in case you make a mistake) After graphing the data, state the conclusion you determined from each Data Set 1 A law professor wanted to determine if the amount of time students spend studying and preparing for exams has a noticeable effect on the scores earned. At…arrow_forward
- The pesticide DDT was widely used in the 1940s as a method of insect control. In the late 1950s the first DDT-resistant mosquitoes were discovered, and eventually DDT-resistant mosquitoes were found globally. When DDT is used now, the development of DDT resistance in mosquito populations occurs in months rather than years.Which of the following best explains the observations concerning DDT resistance in mosquitoes?* nd 2 chool The proportion of DDT-resistant mosquitoes in a population remains constant due to O the metabolic costs of DDT utilization DDT is a chemical signal that delays normal reproductive cycles in many mosquito populations. Natural selection favors DDT-resistant mosquitoes that are already present in a population when DDT exposure occurs. Competition for limited resources causes mosquitoes to migrate to geographical areas that have richer supplies of DDT. A population of 1.492 finches is intróduced to a rainforest. Over the next year, the finches show a death rate of…arrow_forwardGive only typing answer with explanation and conclusion Researchers were measuring the % change in range sizes of 42 mammal species over a 50 year period. The values ranged from -14.6% (indicating a decrease of 14.6% in the range size) to +32.1% (indicating an increase of 32.1% in the range size). On average, the mean % change across all the species was +6.3%. To test whether this result differed from the null hypothesis expectation that the mean change would be 0% what test should the researchers use? a) independent sample t-test b) paired t-test c) non-parametric test d) single sample t-testarrow_forwardCan someone please let me know what this map is depicting? This is not a graded question. I am simply doing research on migratory patterns of roe deer and I am confused about this. What are the upper range figures depicting? Why is there a spread between the weeks? I just need help understanding the altitudinal gradient.arrow_forward
arrow_back_ios
SEE MORE QUESTIONS
arrow_forward_ios
Recommended textbooks for you
 Biology Today and Tomorrow without Physiology (Mi...BiologyISBN:9781305117396Author:Cecie Starr, Christine Evers, Lisa StarrPublisher:Cengage Learning
Biology Today and Tomorrow without Physiology (Mi...
Biology
ISBN:9781305117396
Author:Cecie Starr, Christine Evers, Lisa Starr
Publisher:Cengage Learning
Introduction to the NIOSH Manual of Analytical Methods Fifth edition; Author: Centers for Disease Control and Prevention (CDC);https://www.youtube.com/watch?v=B5rUrKLMoas;License: Standard Youtube License