Use the following diagram: PRICE P Supply Demand QUANTITY The diagram above shows the demand and supply curves for a normal good. The equilibrium price could rise from P1 to P2 if the population increases and there are more potential buyers in the market P2 were set as a price ceiling taxes on the product decreased the price of a substitute product decreased the technology used to produce the good improved in efficiency
Use the following diagram: PRICE P Supply Demand QUANTITY The diagram above shows the demand and supply curves for a normal good. The equilibrium price could rise from P1 to P2 if the population increases and there are more potential buyers in the market P2 were set as a price ceiling taxes on the product decreased the price of a substitute product decreased the technology used to produce the good improved in efficiency

Chapter7: Market Efficiency And Welfare
Section: Chapter Questions
Problem 8P

Related questions

Question
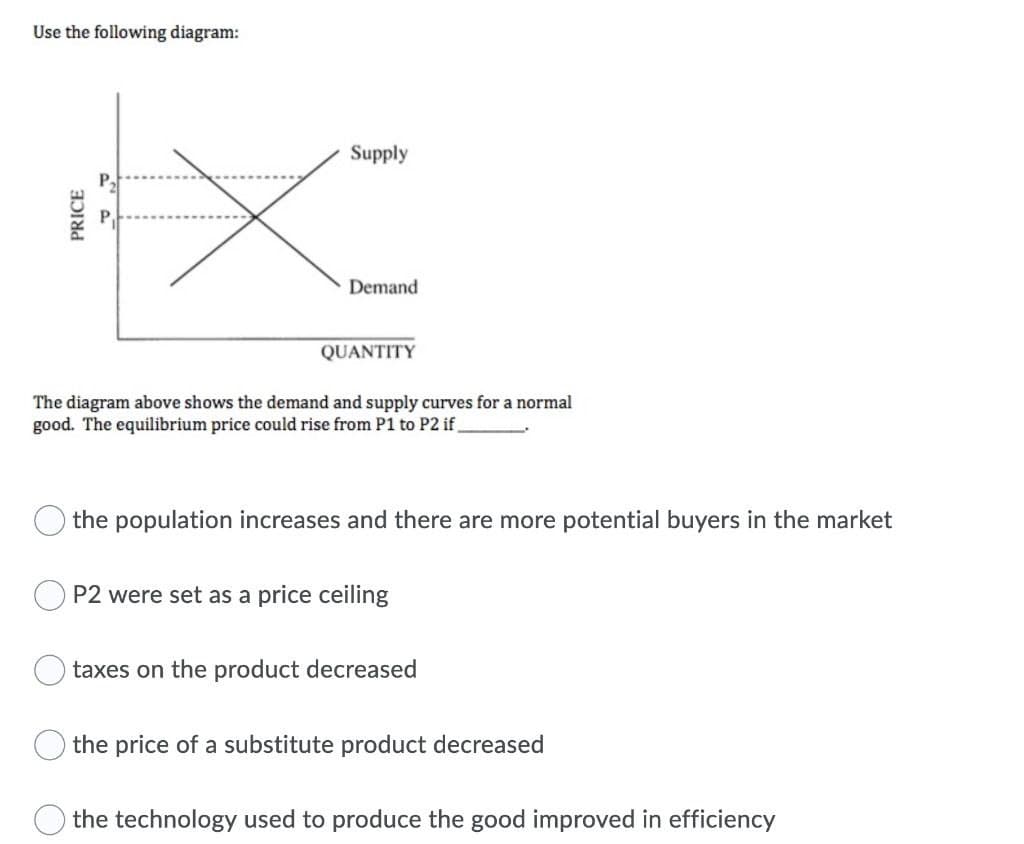
Transcribed Image Text:Use the following diagram:
PRICE
Supply
Demand
QUANTITY
The diagram above shows the demand and supply curves for a normal
good. The equilibrium price could rise from P1 to P2 if.
the population increases and there are more potential buyers in the market
P2 were set as a price ceiling
taxes on the product decreased
the price of a substitute product decreased
the technology used to produce the good improved in efficiency
Expert Solution
This question has been solved!
Explore an expertly crafted, step-by-step solution for a thorough understanding of key concepts.

This is a popular solution!

Trending now
This is a popular solution!

Step by step
Solved in 4 steps with 1 images

Knowledge Booster


Learn more about
Need a deep-dive on the concept behind this application? Look no further. Learn more about this topic, economics and related others by exploring similar questions and additional content below.Recommended textbooks for you
Exploring Economics
Economics
ISBN:
9781544336329
Author:
Robert L. Sexton
Publisher:
SAGE Publications, Inc


Principles of Economics 2e
Economics
ISBN:
9781947172364
Author:
Steven A. Greenlaw; David Shapiro
Publisher:
OpenStax
Exploring Economics
Economics
ISBN:
9781544336329
Author:
Robert L. Sexton
Publisher:
SAGE Publications, Inc
Principles of Economics 2e
Economics
ISBN:
9781947172364
Author:
Steven A. Greenlaw; David Shapiro
Publisher:
OpenStax