
Business Analytics
3rd Edition
ISBN: 9780135231715
Author: Evans
Publisher: PEARSON
expand_more
expand_more
format_list_bulleted
Concept explainers
Videos
Textbook Question
Chapter A3, Problem 1PE
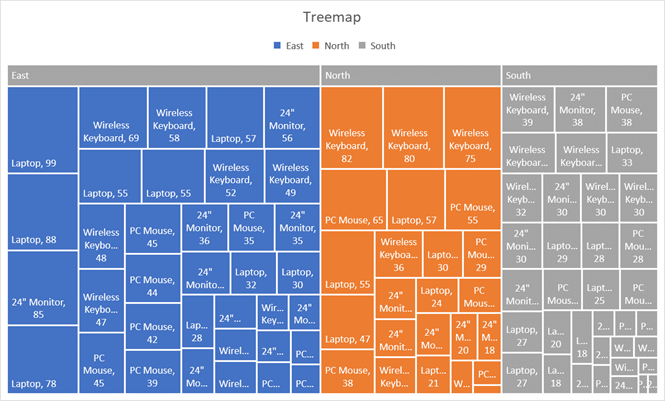
Create a treemap for the regions, items, and units sold in the Excel file Store and Regional Sales Database.
Expert Solution & Answer
To determine
To create a Tree map for the regions, items, and unit sold.
Explanation of Solution
Given:
The data contains ID, Store No., Sales region, Item number, Item description, Unit price, unit sold and week ending.
To create tree map, need to select column of regions, item description, and unit sold.
Now select Insert→Insert Hierarchy chart→Treemap
Following is the Tree map:
Want to see more full solutions like this?
Subscribe now to access step-by-step solutions to millions of textbook problems written by subject matter experts!
Students have asked these similar questions
Suppose you need to summarize ordinal data in a bar graph. How would you arrange the categories of data on the horizontal axis? Is it possible to make the order of the data apparent in a pie chart?
Can you help me fill out these tables
PLEASE PROVIDE TABLE ALSO
Chapter A3 Solutions
Business Analytics
Ch. A3 - Create a treemap for the regions, items, and units...Ch. A3 - Create a sunburst chart for the regions, items,...Ch. A3 - Use PivotTables to find the number of loans by...Ch. A3 - Use PivotCharts to create a useful dashboard for...Ch. A3 - Prob. 6PECh. A3 - Use PivotCharts to create a useful dashboard for...Ch. A3 - Prob. 9PE
Additional Math Textbook Solutions
Find more solutions based on key concepts
Refer to the Real Estate data, which reports information on homes sold in the Goodyear, Arizona, area during th...
Statistical Techniques in Business and Economics
Provide an example of a qualitative variable and an example of a quantitative variable.
Elementary Statistics (Text Only)
Teacher Salaries
The following data from several years ago represent salaries (in dollars) from a school distri...
Elementary Statistics: A Step By Step Approach
(a) Make a stem-and-leaf plot for these 24 observations on the number of customers who used a down-town CitiBan...
Applied Statistics in Business and Economics
The manufacturer of a nationally distributed brand of potato chips wants to determine the feasibility of changi...
Basic Business Statistics, Student Value Edition (13th Edition)
Knowledge Booster


Learn more about
Need a deep-dive on the concept behind this application? Look no further. Learn more about this topic, statistics and related others by exploring similar questions and additional content below.Similar questions
Recommended textbooks for you
 Elementary Geometry For College Students, 7eGeometryISBN:9781337614085Author:Alexander, Daniel C.; Koeberlein, Geralyn M.Publisher:Cengage,
 Algebra: Structure And Method, Book 1AlgebraISBN:9780395977224Author:Richard G. Brown, Mary P. Dolciani, Robert H. Sorgenfrey, William L. ColePublisher:McDougal Littell
Elementary Geometry For College Students, 7e
Geometry
ISBN:9781337614085
Author:Alexander, Daniel C.; Koeberlein, Geralyn M.
Publisher:Cengage,
Algebra: Structure And Method, Book 1
Algebra
ISBN:9780395977224
Author:Richard G. Brown, Mary P. Dolciani, Robert H. Sorgenfrey, William L. Cole
Publisher:McDougal Littell
Correlation Vs Regression: Difference Between them with definition & Comparison Chart; Author: Key Differences;https://www.youtube.com/watch?v=Ou2QGSJVd0U;License: Standard YouTube License, CC-BY
Correlation and Regression: Concepts with Illustrative examples; Author: LEARN & APPLY : Lean and Six Sigma;https://www.youtube.com/watch?v=xTpHD5WLuoA;License: Standard YouTube License, CC-BY