
Concept explainers
Videos
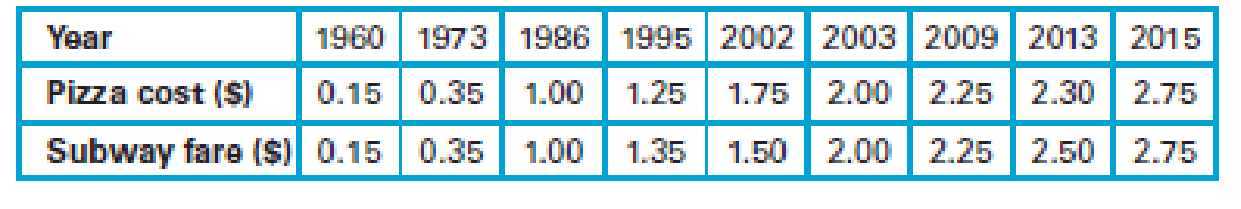
Pizza and the Subway. For Exercises 1–6, refer to the following table that lists the cost (in dollars) of a slice of pizza in New York City and the subway fare in the same year.
1. Construct a
Draw a scatter plot.
Explain the result from the scatter plot.
Answer to Problem 1CRE
- The scatter plot is given below:

Explanation of Solution
Calculation:
The costs of a slice of pizza and the subway fares in New York for a year are given.
Best-fit line:
In a scatter plot, the best possible straight line, which is closest to the points is called best-fit line.
Scatter plot with fitted line:
Software procedure:
Step-by-step software procedure to draw scatter plot using EXCEL software is as follows:
- Open an EXCEL file.
- In column A and B, the Pizza cost and Subway fare data were entered.
- Select the data > click on insert.
- Chose X Y (Scatter) from chart.
- Click OK.
- Click on the data points>right click> add trendline.
- Choose linear.
- Click on display equation on chart and display R-squared value on chart.
- Output using EXCEL software is given below:
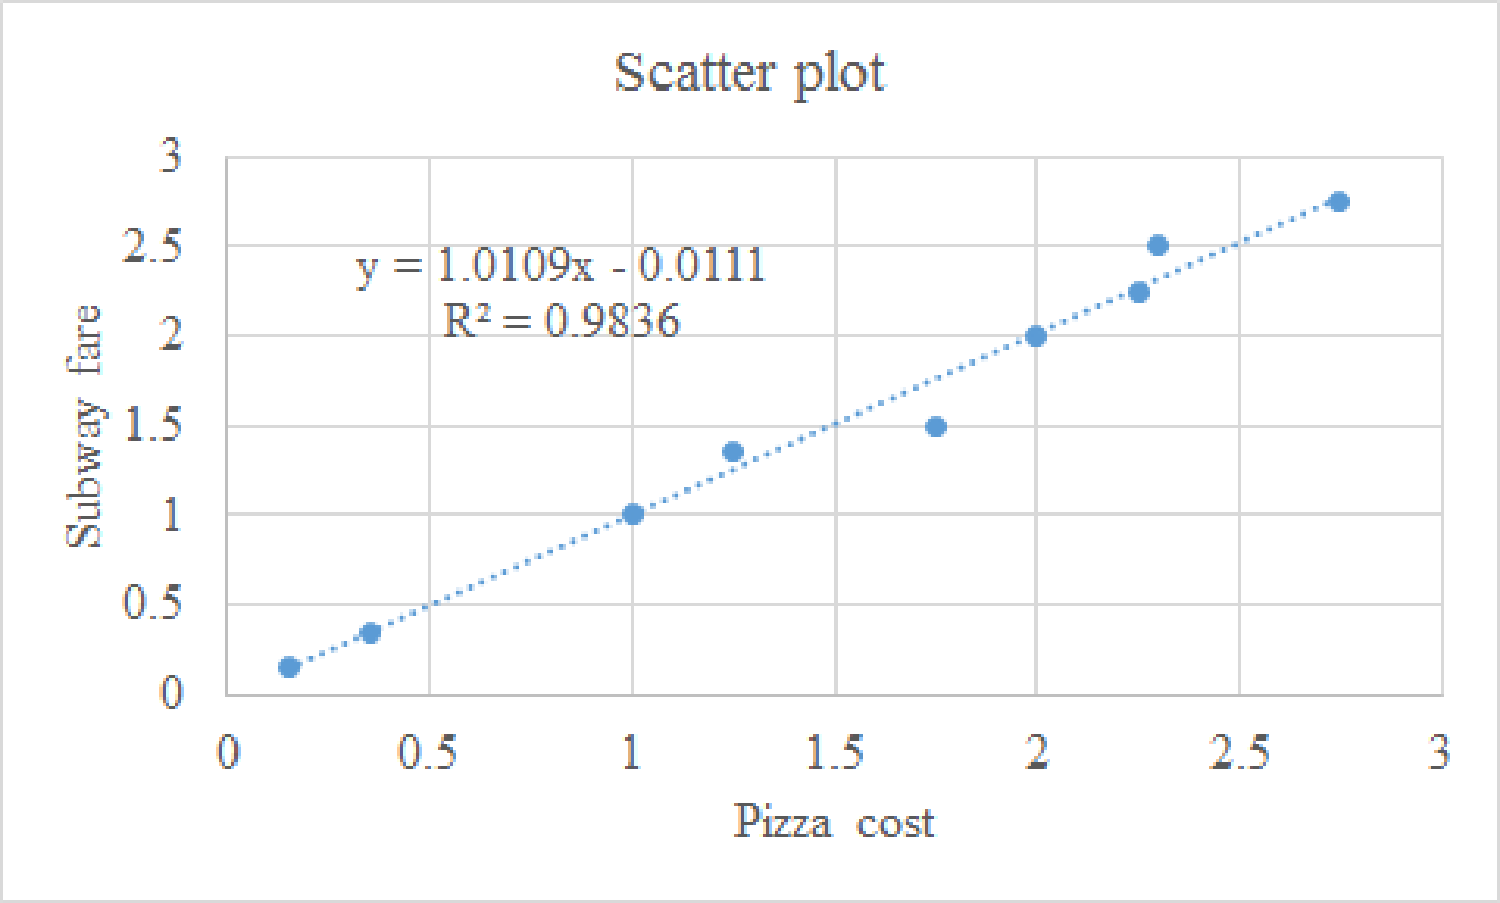
From the above scatter plot, it can be said that all the points are nearer to the best fitted line.
The coefficient of determination is 98.36%. Thus, 98.36% variability in subway fare can be explained by the pizza cost using the best fitted model.
Hence, it can be said that the fit is very good.
Moreover, it can be said that for increasing pizza cost, the subway fare has also increased and the trend line is an ascending trend line. Therefore, there is a strong positive correlation between the variables.
Want to see more full solutions like this?
Chapter 7 Solutions
Statistical Reasoning for Everyday Life (5th Edition)


- The figure shows the graphs of the cost and revenue functions for a company that manufactures and sells small radios. Use the information in the figure to solve Exercises 67–72. 35,000 30,000 C(x) = 10,000 + 30x 25,000 20,000 15,000 R(x) = 50x 10,000 5000 100 200 300 400 500 600 700 Radios Produced and Sold 67. How many radios must be produced and sold for the company to break even? 68. More than how many radios must be produced and sold for the company to have a profit? 69. Use the formulas shown in the voice balloons to find R(200) – C(200). Describe what this means for the company. 70. Use the formulas shown in the voice balloons to find R(300) – C(300). Describe what this means for the company. 71. a. Use the formulas shown in the voice balloons to write the company's profit function, P, from producing and selling x radios. b. Find the company's profit if 10,000 radios are produced and sold. 72. a. Use the formulas shown in the voice balloons to write the company's profit function,…arrow_forwardsection 4.1 #30 In Exercises 25–30, determine whether the association between the two variables is positive or negative. Weekly ice cream sales and weekly average temperaturearrow_forwardQ. Table gives data on gold prices, the Consumer Price Index (CPI), and the New York Stock Exchange (NYSE) Index for the United States for the period 1974 –2006. The NYSE Index includes most of the stocks listed on the NYSE, some 1500-plus. a. Plot in the same scattergram gold prices, CPI, and the NYSE Index. b. An investment is supposed to be a hedge against inflation if its price and /or rate of return at least keeps pace with inflation. To test this hypothesis, suppose you decide to fit the following model, assuming the scatterplot in (a) suggests that this is appropriate: Gold pricet = β1 + β2 CPIt + ut NYSE indext = β1 + β2 CPIt + ut Note that if beta2 = 1 the response exactly grows with CPI Thank you!arrow_forward
- In 2010, MonsterCollege surveyed 1250 U.S.college students expecting to graduate in the next several years.Respondents were asked the following question:What do you think your starting salary will be at your firstjob after college?The line graph shows the percentage of college students whoanticipated various starting salaries. Use the graph to solveExercises 9–14. What starting salary was anticipated by the greatestpercentage of college students? Estimate the percentage ofstudents who anticipated this salary? What starting salary was anticipated by the least percentageof college students? Estimate the percentage of students whoanticipated this salary? What starting salaries were anticipated by more than 20% ofcollege students? Estimate the percentage of students who anticipated astarting salary of $40 thousand.arrow_forwardQ. Table provided gives data on gross domestic product (GDP) for the United States for the years 1959–2005. a. Plot the GDP data in current and constant (i.e., 2000) dollars against time. b. Letting Y denote GDP and X time (measured chronologically starting with 1 for 1959, 2 for 1960, through 47 for 2005), see if the following model fits the GDP data: Yt = β1 + β2 Xt + ut Estimate this model for both current and constant-dollar GDP. c. How would you interpret β2? d. If there is a difference between β2 estimated for current-dollar GDP and that estimated for constant-dollar GDP, what explains the difference? e. From your results what can you say about the nature of inflation in the United States over the sample period?arrow_forwardU.S. Population The number of White non-Hispanicindividuals in the U.S. civilian non-institutional population 16 years and older was 153.1 million in 2000and is projected to be 169.4 million in 2050.(Source: U.S. Census Bureau)a. Find the average annual rate of change in population during the period 2000–2050, with the appropriate units.b. Use the slope from part (a) and the population in2000 to write the equation of the line associatedwith 2000 and 2050.c. What does this model project the population to bein 2020?arrow_forward
- International Visitors The number of internationalvisitors to the United States for selected years 1986–2010 is given in the table below. If you had to pick one of these models to predictthe number of international visitors in the year2020, which model would be the more reasonablechoice?arrow_forwardLarge companies typically collect volumes of data before designing a product, not only to gain information as to whether the product should be released, but also to pinpoint which markets would be the best targets for the product. Several months ago, I was interviewed by such a company while shopping at a mall. I was asked about my exercise habits and whether or not I'd be interested in buying a video/DVD designed to teach stretching exercises. I fall into the male, 18 – 35-years-old category, and I guessed that, like me, many males in that category would not be interested in a stretching video. My friend Amanda falls in the female, older-than-35 category, and I was thinking that she might like the stretching video. After being interviewed, I looked at the interviewer's results. Of the 97 people in my market category who had been interviewed, 16 said they would buy the product, and of the 101 people in Amanda's market category, 31 said they would buy it. Assuming that these data came…arrow_forwardLarge companies typically collect volumes of data before designing a product, not only to gain information as to whether the product should be released, but also to pinpoint which markets would be the best targets for the product. Several months ago, I was interviewed by such a company while shopping at a mall. I was asked about my exercise habits and whether or not I'd be interested in buying a video/DVD designed to teach stretching exercises. I fall into the male, 18 – 35-years-old category, and I guessed that, like me, many males in that category would not be interested in a stretching video. My friend Diane falls in the female, older-than-35 category, and I was thinking that she might like the stretching video. After being interviewed, I looked at the interviewer's results. Of the 93 people in my market category who had been interviewed, 17 said they would buy the product, and of the 113 people in Diane's market category, 34 said they would buy it. Assuming that these data came…arrow_forward
- A survey about social media reported that 79% of B2B marketers (marketers that focus primarily on attracting businesses) plan to increase their use of social media, as compared to 54% of B2C marketers (marketers that primarily target consumers). The survey was based on 1,333 B2B marketers and 1,669 B2C marketers. The accompanying table summarizes the results. Complete parts (a) through (d) below. A Click the icon to view the contingency table about social media use and marketers. Contingency table a. What is the probability that a randomly selected respondent plans to increase use of social media? (Round to three decimal places as needed.) Increase Use of Social Media? Business Focus B2B B2C Total b. What is the probability that a randomly selected respondent is a B2C marketer? Yes 1,049 901 1,950 (Round to three decimal places as needed.) No 284 768 1,052 Total 1,333 1,669 3,002 c. What is the probability that a randomly selected respondent plans to increase use of social media or is…arrow_forwardA survey about social media reported that 82% of B2B marketers (marketers that focus primarily on attracting businesses) plan to increase their use of social media, as compared to 55% of B2C marketers (marketers that primarily target consumers). The survey was based on 1,286 B2B marketers and 1,731 B2C marketers. The accompanying table summarizes the results. Complete parts (a) through (d) below. A. What is the probability that a randomly selected respondent is a B2C marketer? B. What is the probability that a randomly selected respondent plans to increase use of social media or is a B2C marketer? C. Explain the difference in the results in (a) and (b)arrow_forwardChapter 11.4 The comparison Testsarrow_forward
 MATLAB: An Introduction with ApplicationsStatisticsISBN:9781119256830Author:Amos GilatPublisher:John Wiley & Sons Inc
 Probability and Statistics for Engineering and th...StatisticsISBN:9781305251809Author:Jay L. DevorePublisher:Cengage Learning
 Statistics for The Behavioral Sciences (MindTap C...StatisticsISBN:9781305504912Author:Frederick J Gravetter, Larry B. WallnauPublisher:Cengage Learning
 Elementary Statistics: Picturing the World (7th E...StatisticsISBN:9780134683416Author:Ron Larson, Betsy FarberPublisher:PEARSON
 The Basic Practice of StatisticsStatisticsISBN:9781319042578Author:David S. Moore, William I. Notz, Michael A. FlignerPublisher:W. H. Freeman
 Introduction to the Practice of StatisticsStatisticsISBN:9781319013387Author:David S. Moore, George P. McCabe, Bruce A. CraigPublisher:W. H. Freeman