
Thinking Like an Engineer: An Active Learning Approach (4th Edition)
4th Edition
ISBN: 9780134639673
Author: Elizabeth A. Stephan, David R. Bowman, William J. Park, Benjamin L. Sill, Matthew W. Ohland
Publisher: PEARSON
expand_more
expand_more
format_list_bulleted
Concept explainers
Videos
Textbook Question
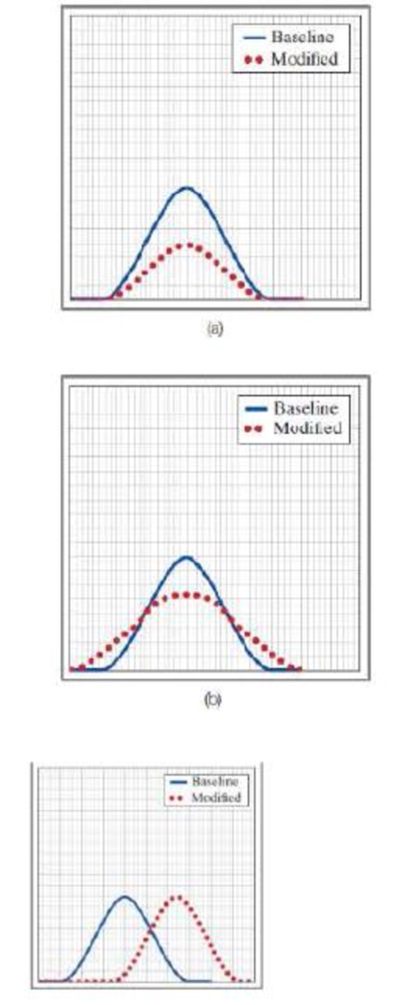
Chapter 14.3, Problem 4CC
For each of the following graphs, decide if the mean, variance, or population size has changed.
Expert Solution & Answer
Want to see the full answer?
Check out a sample textbook solution
Students have asked these similar questions
As an industrial engineer, you intend to use linear trend (or linear regression) method to solve a forecasting problem. You have decided to use the equation of y = m(x) + c to establish the relationship between the sales (y) and the related month (x). It is known that 8 consecutive months data (Jan to Aug) were used and they resulted to the following parameter values of m = 320 and c = 1017. Using the regression technique, estimate the percentage of sales improvement from December this year to June next year.
Q2: File Upload
الزامي ABET
äbäi 15 solve the question on a piece of [Q2]
paper and upload it as ONE FILE here
.{as an image or PDF only}
Question 2
Use the least square regression to fit the data in the following
table to the equation yfit = ae*.
1.5 2
y 1.6 3.7 7 13.5 24.6
1
2.5
(A) Determine the values of a and 3.
(B) What is the standard error of this estimation?
(C) Using the fit equation, what
the value of y at r = 2.25?
إضافة ملف
The following data have the form of exponential function y = a*Exp(x), where Exp(x) denotes the
exponential operation of x.
Find the nearest regression equation. In the answer, 1.00e0.5x represents 1.00*e^0.5x =
1.00*Exp(0.5x)
Y: 0.4, 1, 4, 36
X: 0.2, 2, 4, 8
y = 1.00e0.06x
All solutions are not correct
O y = 0.35e0.58x
O y = 1.35e1.5x
Chapter 14 Solutions
Thinking Like an Engineer: An Active Learning Approach (4th Edition)
Ch. 14.1 - The following table lists the number of computer...Ch. 14.2 - For the following mass data g1ven in units of...Ch. 14.2 - For the following temperature data given in units...Ch. 14.3 - For each of the following graphs, decide if the...Ch. 14.3 - Use the scenario described in Example 14-4. For...Ch. 14.4 - Consider the weight of shipping boxes sent down an...Ch. 14.4 - Prob. 7CCCh. 14.5 - Prob. 8CCCh. 14 - For the following pressure data, recorded in units...Ch. 14 - A technician tested two temperature probes by...
Ch. 14 - One of the NAE Grand Challenges for Engineering is...Ch. 14 - You use the data from the Mauna Loa observatory in...Ch. 14 - Polyetheretherketone (PEEK)TM polymers are...Ch. 14 - A technician tested a temperature probe by...Ch. 14 - During November, the heading system in your...Ch. 14 - You are assigned to inspect metal-composite beam...Ch. 14 - Use the scenario described in the preceding...Ch. 14 - You test several temperature probes by inserting...Ch. 14 - Use the scenario described in the previous Problem...Ch. 14 - Prob. 14ICACh. 14 - The following data were collected from a...Ch. 14 - The following data were collected from a...Ch. 14 - The following table lists the number of resin...
Knowledge Booster


Learn more about
Need a deep-dive on the concept behind this application? Look no further. Learn more about this topic, mechanical-engineering and related others by exploring similar questions and additional content below.Similar questions
- 2 balls are drawn in a succession without replacement from an urn containing 5 white balls and 6 black balls.Let b be the random variable representing the number of black balls.construct the probability distribution of the random variable B.arrow_forwardThe heat flux (q) can be computed with Fourier's law Where q has units of W/m2 and k is the thermal conductivity of the material (W/m.K). T: temperature (K) and x = distance (m) along the path of heat flow. Determine at each point for the following data using the best finite divided approximation formulas. x (cm) T (K)| 10 800 15 760 25 630 35 480 370 40 300 55 200 70arrow_forwardStudent A B D H Number 201780130 2 1 7 8 1 3 Evaluate the following variables and use them as given in the following problems. 200 if I is even, 250 if I is odd (D + G)*10 (H + I/2, if in case the result is zero, use 3 (A +C + E)*2 (P + M)*20 H + 5 M Q %3D 50(E + G + 1) II II || || || |||| ZNPORXarrow_forward
- 1) Graph 1: plot t on the abscissa versus y on the ordinate and (artistically) draw a smooth line through the points. The line need not actually go through each data point. 2) Graph 2: plot t^2 on the abscissa versus y on the ordinate and then perform a linear regression. Remember to plot both the raw data points and the line of best fit (with the two points used to draw it); also show the regression equation and r value on the graph. 3) On graph (1), what does the slope of the line tell you about the velocity of the ball? Be thorough! 4) On graph 2: a) What does the slope of the line tell you about the acceleration of the ball? Be thorough! b) Calculate g from the freefall data and the % error (in comparison to 9.81 m/s^2) using the results from the linear regression calculation. c) What do the values of the y-intercept and correlation coefficient (r) tell you?arrow_forwardFor the given data generate the forecast for each of the time period using moving average for n=3 periods and weighted moving average for n=D4, also find the forecast for the 9th 10th and 11th. S.NO DEMANDS MOVING AVERAGE n=3 WEIGHTED MOVING AVERAGE n=4 1 100 2 120 3 110 4 130 110 140 120 119 160 126.67 129 7 150 143.33 143 8 140 150 148 9. 150 147arrow_forwardThe orthographic views of an object are shown below. a) Draw its isometric drawing using a pencil. Provide all important dimensions on your isometric drawing. b) You need to take pictures of all main steps and need to provide a step-by-step method to draw isometric drawing accompanied by pictures. 307303030 | 20 60 15 15 55 30 20 60 + 27.5 4 25 47.5 25 R20 20 T 15 60 016 120 R30 120 120 30arrow_forward
- determine the regression line equation plot the line on a graph and summarize the results( reject or do not) is there enough evidence? please and thank you!arrow_forwardA study was made on the amount of converted sugar in a certain process at various temperatures. The data were coded and recorded as follows: Temperature, x : 1.0 1.1 1.2 1.3 1.4 15 1.6 1.7 1.8 1.9 2.0 Converted Sugar, y: 8.1 7.8 8.5 9.8 9.5 8.9 8.6 10.2 9.3 9.2 10.5 Estimate the mean amount of converted sugar produced when the coded temperature is 1.75. (1 decimal place)arrow_forwardA study was made on the amount of converted sugar in a certain process at various temperatures. The data were coded and recorded as follows: Temperature, x: 1.0 1.1 1.2 1.3 1.4 11.5 1.6 1.7 1.8 1.9 2.0 Converted Sugar, y : 8.1 8.8 8.5 9.8 9.5 8.9 8.6 10.2 9.3 10.2 10.5 Estimate the mean amount of converted sugar produced when the coded temperature is 2.8. (2 decimal places)arrow_forward
- 4. Develop a model using regression analysis for trip production using the following data. Zone Number Trip production Trip Vehicle Employment attraction ownership 1 200 1 1000 256 1.5 1250 345 2500 6. 451 2.8 3600 5 6.5 555 4200 6. 7 600 4 4500 3. 2. 3. 2. 3. 4.arrow_forwardThe number of suits sold per week by a store follows a Poisson distribution with mean 14. Then the probability that the magazine sold exactly 2 suits per day is equal to: O None of these O 0.2707 0.0001 0.6767arrow_forwardProjects A and B are mutually exclusive. The minimum attractive rate of return (MARR) is 12%. Using rate of return analysis, which project should be selected? If the image fails to load here, go to https://www.dropbox.com/s/ld6wctqieu8jgwp/ROR.jpg Year 0 1 2 3 4 ROR A - $750 $200 $200 $200 $600 17.68% B - $1,150 $300 $350 $400 $700 16.44% O Project A O Project B O Both Project A and B O Select none of the project. O Insufficient information to make a decision. B-A - $400 $100 $150 $200 $100 13.69%arrow_forward
arrow_back_ios
SEE MORE QUESTIONS
arrow_forward_ios
Recommended textbooks for you
 Elements Of ElectromagneticsMechanical EngineeringISBN:9780190698614Author:Sadiku, Matthew N. O.Publisher:Oxford University Press
 Mechanics of Materials (10th Edition)Mechanical EngineeringISBN:9780134319650Author:Russell C. HibbelerPublisher:PEARSON
 Thermodynamics: An Engineering ApproachMechanical EngineeringISBN:9781259822674Author:Yunus A. Cengel Dr., Michael A. BolesPublisher:McGraw-Hill Education
 Control Systems EngineeringMechanical EngineeringISBN:9781118170519Author:Norman S. NisePublisher:WILEY
 Mechanics of Materials (MindTap Course List)Mechanical EngineeringISBN:9781337093347Author:Barry J. Goodno, James M. GerePublisher:Cengage Learning
 Engineering Mechanics: StaticsMechanical EngineeringISBN:9781118807330Author:James L. Meriam, L. G. Kraige, J. N. BoltonPublisher:WILEY
Elements Of Electromagnetics
Mechanical Engineering
ISBN:9780190698614
Author:Sadiku, Matthew N. O.
Publisher:Oxford University Press
Mechanics of Materials (10th Edition)
Mechanical Engineering
ISBN:9780134319650
Author:Russell C. Hibbeler
Publisher:PEARSON
Thermodynamics: An Engineering Approach
Mechanical Engineering
ISBN:9781259822674
Author:Yunus A. Cengel Dr., Michael A. Boles
Publisher:McGraw-Hill Education
Control Systems Engineering
Mechanical Engineering
ISBN:9781118170519
Author:Norman S. Nise
Publisher:WILEY
Mechanics of Materials (MindTap Course List)
Mechanical Engineering
ISBN:9781337093347
Author:Barry J. Goodno, James M. Gere
Publisher:Cengage Learning
Engineering Mechanics: Statics
Mechanical Engineering
ISBN:9781118807330
Author:James L. Meriam, L. G. Kraige, J. N. Bolton
Publisher:WILEY
What is Metrology in Mechanical Engineering? | Terminologies & Measurement; Author: GaugeHow;https://www.youtube.com/watch?v=_KhMhFRehy8;License: Standard YouTube License, CC-BY