What is the sample mean, sample standard deviation, minimum, and maximum of the total time in the system observed for the customers who arrived at, and departed from, the system during the time interval [100.0, 120.0]? Using Excel formulas. 101000 12001 lation table
What is the sample mean, sample standard deviation, minimum, and maximum of the total time in the system observed for the customers who arrived at, and departed from, the system during the time interval [100.0, 120.0]? Using Excel formulas. 101000 12001 lation table

Practical Management Science
6th Edition
ISBN:9781337406659
Author:WINSTON, Wayne L.
Publisher:WINSTON, Wayne L.
Chapter2: Introduction To Spreadsheet Modeling
Section: Chapter Questions
Problem 20P: Julie James is opening a lemonade stand. She believes the fixed cost per week of running the stand...

Related questions
Question
100%
![Question:
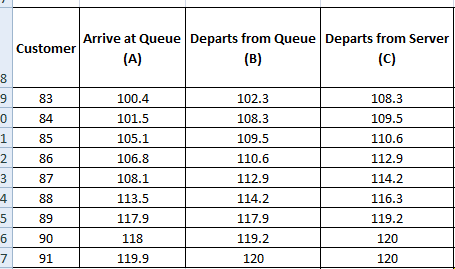
What is the sample mean, sample standard deviation, minimum, and maximum of the total time in the system observed for the customers who arrived at, and departed from, the system during the time interval [100.0, 120.0]? Using Excel formulas.
What is the time-averaged (time-weighted) mean number waiting in the queue during the time interval [100.0, 120.0] using a hand simulation table.
Customer Arrives at Queue Departs from Queue Departs from Server Time in Queue Time in Service Total Time in System
83
100.4
102.3
108.3
84
101.5
108.3
109.5
85
105.1
110.6
86
106.8
112.9
87
108.1
114.2
88
113.5
116.3
89
117.9
119.2
90
118
91
119.9
109.5
110.6
112.9
114.2
117.9
119.2
After 120.0
After 120.0
After 120.0
Mean
SD
Min
Max
Just Finished Event
Variables Attributes (Arr Times)
Time t Event Type Q(t) B(t) (In Queue) In Service P
Entity #
N
Statistical Accumulators
Event Calendar
[WQ WQ* ETS TS* JQ(t) Q(t)* JB(t) Entity # Time Type](/v2/_next/image?url=https%3A%2F%2Fcontent.bartleby.com%2Fqna-images%2Fquestion%2F4a7e19b9-35b0-4a8a-a357-f6dfd6295163%2F3ed83c2f-1780-4537-a9a3-dbd8c1fd5d19%2Flbj8378_processed.jpeg&w=3840&q=75)
Transcribed Image Text:Question:
What is the sample mean, sample standard deviation, minimum, and maximum of the total time in the system observed for the customers who arrived at, and departed from, the system during the time interval [100.0, 120.0]? Using Excel formulas.
What is the time-averaged (time-weighted) mean number waiting in the queue during the time interval [100.0, 120.0] using a hand simulation table.
Customer Arrives at Queue Departs from Queue Departs from Server Time in Queue Time in Service Total Time in System
83
100.4
102.3
108.3
84
101.5
108.3
109.5
85
105.1
110.6
86
106.8
112.9
87
108.1
114.2
88
113.5
116.3
89
117.9
119.2
90
118
91
119.9
109.5
110.6
112.9
114.2
117.9
119.2
After 120.0
After 120.0
After 120.0
Mean
SD
Min
Max
Just Finished Event
Variables Attributes (Arr Times)
Time t Event Type Q(t) B(t) (In Queue) In Service P
Entity #
N
Statistical Accumulators
Event Calendar
[WQ WQ* ETS TS* JQ(t) Q(t)* JB(t) Entity # Time Type
Expert Solution
Step 1
Since there are multiple questions being asked.
We will answer the first questions, which still asks 4 parameters to be calculated.
For other parts, pls submit as separate questions.
Given:-

Trending now
This is a popular solution!

Step by step
Solved in 2 steps with 3 images

Recommended textbooks for you
Practical Management Science
Operations Management
ISBN:
9781337406659
Author:
WINSTON, Wayne L.
Publisher:
Cengage,

Operations Management
Operations Management
ISBN:
9781259667473
Author:
William J Stevenson
Publisher:
McGraw-Hill Education

Operations and Supply Chain Management (Mcgraw-hi…
Operations Management
ISBN:
9781259666100
Author:
F. Robert Jacobs, Richard B Chase
Publisher:
McGraw-Hill Education
Practical Management Science
Operations Management
ISBN:
9781337406659
Author:
WINSTON, Wayne L.
Publisher:
Cengage,
Operations Management
Operations Management
ISBN:
9781259667473
Author:
William J Stevenson
Publisher:
McGraw-Hill Education
Operations and Supply Chain Management (Mcgraw-hi…
Operations Management
ISBN:
9781259666100
Author:
F. Robert Jacobs, Richard B Chase
Publisher:
McGraw-Hill Education


Purchasing and Supply Chain Management
Operations Management
ISBN:
9781285869681
Author:
Robert M. Monczka, Robert B. Handfield, Larry C. Giunipero, James L. Patterson
Publisher:
Cengage Learning

Production and Operations Analysis, Seventh Editi…
Operations Management
ISBN:
9781478623069
Author:
Steven Nahmias, Tava Lennon Olsen
Publisher:
Waveland Press, Inc.