The following estimated regression equation based on 10 observations was presented. ŷ = 26.1570+ 0.5205x₁ +0.495x2 502 
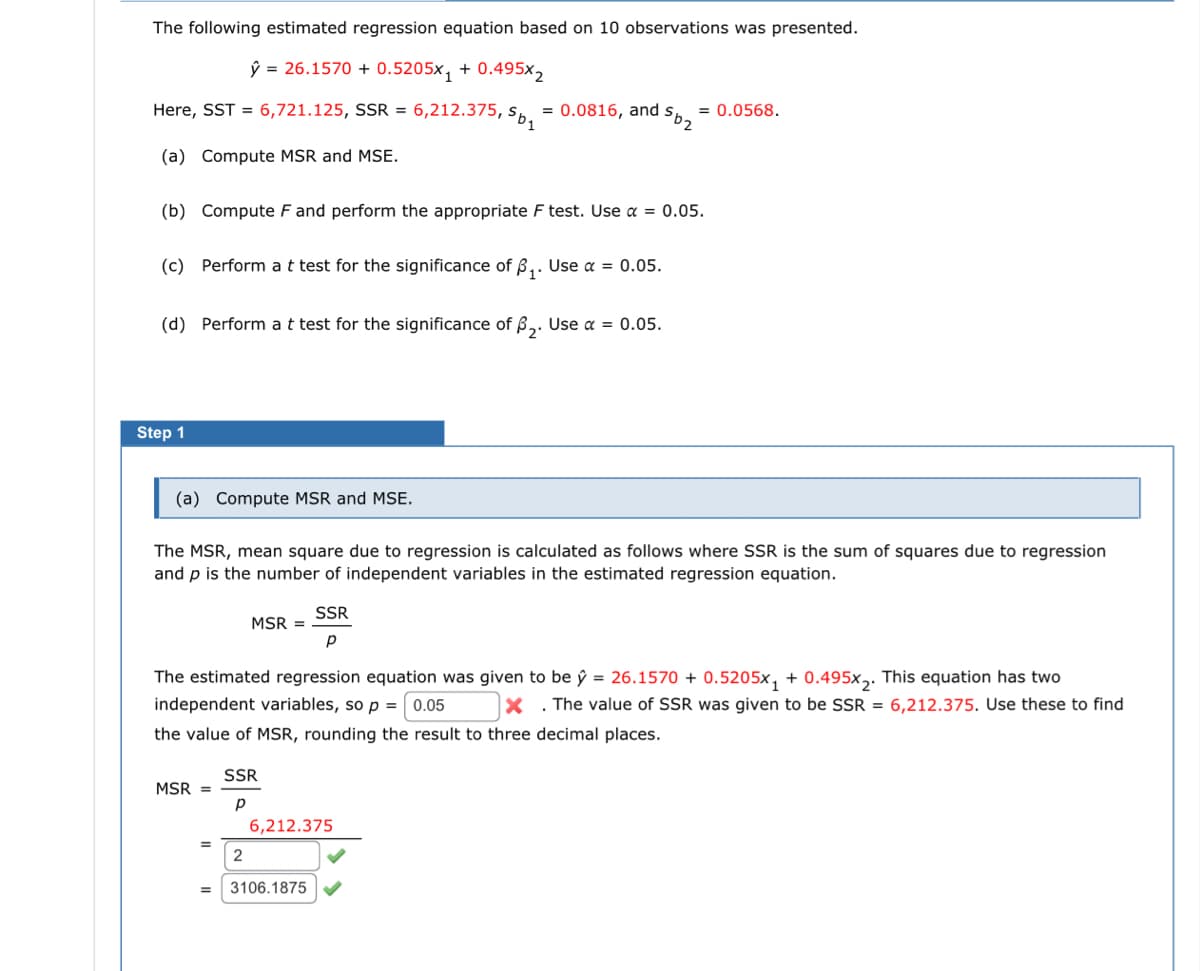
Here, SST = 6,721.125, SSR = 6,212.375, Sb₁ = 0.0816, and (a) Compute MSR and MSE. = 0.0568. (b) Compute F and perform the appropriate F test. Use a = 0.05. (c) Perform a t test for the significance of ₁. Use α = 0.05.
Q: In a poll conducted by the General Social Survey, 70% of respondents said that their jobs were…
A: From the provided information,70% of respondents said that their jobs were sometimes or always…
Q: Find the margin of error for the given values of c, s, and n. c=0.80, s = 6, n = 10 Click the icon…
A: Given thatconfidence level (C) = 0.80 =80%Standard deviation (s) = 6Sample size (n) = 10Level of…
Q: The average lifespan of a set of tires is 38,000 miles, with a standard deviation of 1500 miles.…
A: Let X be the average lifespan of a set of tires is 38,000 miles, with a standard deviation of 1500…
Q: a) In a binomial distribution containing of 10 independent trials, probability of 1 and 2 successes…
A: Hello! As you have posted 2 different questions, we are answering the first question. In case you…
Q: Consider a binomial experiment with n = 20 and p = 0.70. a. Compute f(12) (to 4 decimals). b.…
A: Hello! As you have posted more than 3 sub-parts, we are answering the first 3 sub-parts. In case…
Q: Color Red Green Blue Pink White Number of Marbles 23 22 13 17 10 of the bag, what is the probability…
A: Given:The total number of marbles of other colors other than white or blue =…
Q: Ultra high-performance concrete (UHPC) is a relatively new construction material that i…
A: The data values are:107.1, 109.5, 107.4, 106.8, 108.1.Assume the sample observations are selected…
Q: In an insurance company the number of claims are modelled as a Poisson process with rate > 0. Assume…
A: Number of claims are modelled as a Poisson process with rate .Premium income per unit time = Let…
Q: A study was carried out to compare mean customer satisfaction scores at service centers in city A,…
A: Given information:
Q: a) In a binomial distribution containing of 10 independent trials, probability of 1 and 2 successes…
A: Hello! As you have posted 2 different questions, we are answering the first question. In case you…
Q: An experiment consists of 8 independent trials where the probability of success on each trial is…
A: We have given the following information:Number of trials: Probability of success on each trial:
Q: Let X be a Uniform(-9,9) random variable. (a) The moment generating function of X is Mx(t) = A(eBt –…
A: X∼U(−9,9) and is an independently drawn from U(−9,9)Objective:Find moment generating function…
Q: Professor Frank Nabarro insists that all senior physics majors take his notorious physics aptitude…
A: 75% of all senior physics majors in fact go on to a career in physics. P(N) =0.25 and P(N') =0.75
Q: A random variables has a normal distribution with 110.4 and o = 37.1. You intend to draw a random…
A: Solution
Q: Let X and Y be continuous random variables with joint probability density function f(x,y)={cxy…
A: The objective of this question is to find the constant 'c' in the joint probability density function…
Q: Write a linear equation in slope-intercept form that models each scenario. State what y, m, x, and…
A: Solution
Q: Assume that random guesses are made for eight multiple choice questions on an SAT test, so that…
A: From the provided information,
Q: Suppose that 2 balls are chosen without replacement from an urn consisting of 5 white and 7 red…
A: The provided information is as follows:The total number of white balls is 5.The total number of red…
Q: You are a fast-food mogul and own 50 franchises of Longhorn Burgers and 40 franchises of Perfect…
A: Since the sample size is large (>30), the approximate distribution of the sample average (using…
Q: How many different ways are there to select three dozen colored roses if red, yellow, pink, white,…
A: Solution-:Given: Available roses - red, yellow, pink, white, purple, and orange We want to find how…
Q: In a random sample of 50 dogs in Honolulu, the average weight was 12.4 pounds, with a sample…
A: Sample mean (x̄) = 12.4 poundsSample standard deviation (s) = 1.6 poundsHere, we should use the…
Q: The following table shows the number of females in a country in 2000, broken down by age. Numbers…
A: Given frequency distribution table is,AgeNumber (Million)0 - 1838.818 - 2514.325 - 3519.935 -…
Q: 1- A box contains four tickets with numbers 1, 1, 2, 3. Draw two tickets at random with replacement,…
A: A box contains 4 tickets with numbers 1, 1, 2, 3.Two tickets will be drawn at random with…
Q: Determine whether the events A and B are independent. P(A) = 0.45, P(B) = 0.65, and P(An B) = 0.25…
A: P(A)=0.45P(B)=0.65P(A∩B)=0.25
Q: A population of values has a normal distribution with 104.1 and o = 99.5. You intend to draw a…
A: Mean()=104.1standard deviation()=99.5sample of size(n)=19
Q: A snack-size bag of M&Ms candies is opened. Inside, there are 12 red candies, 12 blue, 7 green,…
A: The objective of this question is to find the probability that the first two candies drawn are…
Q: Given the following Venn diagram: A 0.36 DATA 0.29 B b) Calculate the probability P (B|A) =? 0.17…
A: P(A|B)=P(AandB)P(B)
Q: Suppose that, for some N, the continuous random variables X₁, X2,..., XN are independently drawn…
A: Given that, for some N, the continuous random variables are independently drawn from the uniform…
Q: If Z is a standard normal random variable, prove this companion to the inequality example.…
A: Given that Z is a standard normal random variable and the inequality example:
Q: The probability that a basketball player will make a basket each time he shoots is 0.89. If he…
A: Given:The probability of making a basket (success) is p=0.89.The number of shots taken is n=15.We…
Q: In a bag, there are 5 green marbles, 3 red marbles, and 2 blue marbles. If you draw two marbles…
A: When drawing marbles without replacement, the probability changes with each draw.
Q: A university is putting together a hiring committee of 6 members for the next university provost.…
A: Answer The total pool member = 12+5+10 = 27We need to select…
Q: Two college students are studying for an exam. Student X is smarter than sudent Y. The grade that…
A: The joint pdf for X and Y are given as:
Q: Which of the following is NOT a valid probability density function? 0.04x for 0<x<5
A: Condition for valid density function:
Q: A new medical test is designed to quickly detect whether someone is infected by SARS or not. The…
A: According to the question, To answer this, we need to calculate the probability that a person is…
Q: Hello, The site shows two different answers for (a) I would like clarification as to which is…
A: The provided information is as follows:The total number of people in the line-up in a random order…
Q: Q 6.2. Let X = (X1, X2, X3)T MVN(x, Ex) where 2 -3 -() 1 fx = and Ex: = 6 -2 L - -2 - (a) Compute…
A: Given, where and
Q: In a recent study, 35% of people surveyed indicated chocolate was their favorite flavor of ice…
A: Sample size(n)=10and p=0.35A random variable XBinomial(n=10 , p=0.35)P(X=x)=
Q: Q1 Let (X₁, X₂) be jointly continuous with joint probability density function " f(x1, x₂) = x1 0<x₂…
A:
Q: 3r² 1. The radius R of a certain disk is a continuous random variable with pdf fr(r) = 125' (a) What…
A: The continuous random variable with pdf is given as follows:
Q: Al Bundy is evaluating a new advertising program that could increase shoe sales. Possible outcomes…
A: The formula of coefficient of variation is,From the information, given the probability distribution…
Q: The superintendent of a large school district, having once had a course in probability and…
A: Number of absencesFrequency011428310485666738291101
Q: Q4. We have two coins; the first is fair and the second two-headed. We pick one of the coins at…
A: Given that, we have two coins.The first coin is fair, and the second coin is two-headed.We pick one…
Q: Find the margin of error for the given values of c, s, and n. c = 0.98, s = 2.3, n = 18 Click the…
A: Confidence level(c)=0.98standard deviation(s)=2.3sample size(n)=18
Q: 10. X 0 15 30 45 60 P(X=x) 0.24 0.46 0.13 0.11 0.06
A: We have given a probability mass function of a random variable as follows:…
Q: he breaking strength of a rivet has a mean value of 10,050 psi and a standard deviation of 501 psi.…
A: Given:Mean Standard deviation
Q: You own a bakery and are making scores for a party. Unfortunately, the order is too large and you…
A: The worker is not very good at making scones and thus each scone only has an 80% chance of being…
Q: Suppose calls are arriving at a telephone exchange at an average rate of one per second, according…
A: Suppose calls are arriving at a telephone exchange at an average rate of one per second, according…
Q: If the probability for the capacity of a system design to meet its intended objective is 95%, the…
A: The probability for the capacity of a system design to meet its intended objective is .System…
Q: A bucket contains 2 red balls, 4 yellow balls, and 5 purple balls. One ball is taken from the bucket…
A: A bucket contains 2 red balls, 4 yellow balls and 5 purple balls.
Trending now
This is a popular solution!
Step by step
Solved in 5 steps with 18 images
- Olympic Pole Vault The graph in Figure 7 indicates that in recent years the winning Olympic men’s pole vault height has fallen below the value predicted by the regression line in Example 2. This might have occurred because when the pole vault was a new event there was much room for improvement in vaulters’ performances, whereas now even the best training can produce only incremental advances. Let’s see whether concentrating on more recent results gives a better predictor of future records. (a) Use the data in Table 2 (page 176) to complete the table of winning pole vault heights shown in the margin. (Note that we are using x=0 to correspond to the year 1972, where this restricted data set begins.) (b) Find the regression line for the data in part ‚(a). (c) Plot the data and the regression line on the same axes. Does the regression line seem to provide a good model for the data? (d) What does the regression line predict as the winning pole vault height for the 2012 Olympics? Compare this predicted value to the actual 2012 winning height of 5.97 m, as described on page 177. Has this new regression line provided a better prediction than the line in Example 2?Consider a simple linear regression model Y=α+βX+ε. We have collected 15 samples, from which we calculated the summary statistics ∑xi=66, ∑x2i=6568, ∑yi=459, ∑y2i=27933, ∑xiyi=11311. Suppose one of the data is supposed to be (x1=10, y1=30), but is incorrectly recorded as (x1=7, y1=34). All other observations are correctly recorded. What is the OLS estimators αˆ= ? and βˆ= ? based on the correct data.The birth lengths in cm (x) and birth weights in kg (y) of a sample of 50 newborn female babies are compared, yielding a correlation coefficient of r=0.578 and a linear regression equation of ŷ =−8.89+0.243x The babies all had lengths between 46.5 and 53.0 cm, and weights between 2.50 and 4.05 kg. Based on this, predict the birth weight of a newborn female baby with a birth length of 48.5 cm.
- In a regression analysis involving 25 observations, the following estimated regression equation was developed.ŷ = 10 – 18x1 + 3x2 + 14x3Also, the following standard errors and the sum of squares were obtained.Sb1 = 3 Sb1 = 6 Sb1 = 7SST = 4,800 SSE = 1,296If we are interested in testing for the significance of the relationship among the variables (i.e., significance of the model), the critical value of F at α = .05 is _____..The worker has noticed that the more time he spends at work (x), the less money he is likely to make (y) in conducting transactions for his firm. Which of the regression equations MOST suggests such a possibility?he following estimated regression model was developed relating yearly income (y in $1000s) of 30 individuals with their age (x1) and their gender (x2) (0 if male and 1 if female).ŷ = 30 + 0.7x1 + 3x2Also provided are SST = 1200 and SSE = 384. The yearly income of a 24-year-old female individual is
- Assume a person got score of 32.5 on Test A and a score of 95.25 on Test B. Using the regression equation (B' = 2.3A + 9.5), what is the error of prediction for this person?The Life Insurance Company is attempting to model the weight, Y (in pounds), of a random sample of n=92 randomly selected adults using height, X1 (in inches), and gender, I2 (0 = Male 1=Female). In addition, as part of the research objective, we also wish to determine if the influence of height (X1) on weight (Y) depends on gender (I2) and vice versa. Write out the general regression equation for this model, based on the research objectives and information provided. Using the general equation from part A, write out the specific regression equation for a female. Using the general equation from part A, write out the specific regression equation for a male. If it was found that the influence of height on weight did NOT depend on gender, how would this change the equation given in part A of this problem? Rewrite the general equation from part A here.1. Based on the given data, find the estimated regression equation using least square methods.
- There is a linear regression: Yi = B0+ B1(Xi^2)+ ei present, where Xi is squared. ei ∼ N(0,σ2). How would I derive LSE for B0 and B1 and their variance?It is known that the linear regression equation: y= -2.88+1.77x, with a coefficient of determination of 0.81. Based on the two information, the correlation coefficient isSuppose the following data were collected from a sample of 5 car manufacturers relating monthly car sales to the number of dealerships and the quarter of the year. Use statistical software to find the following regression equation: SALESi= b0 + b1DEALERSHIPSi + b2 QUARTER1i+ b3QUARTER2i + b4QUARTER3i+ ei Is there enough evidence to support the claim that on average, car sales are higher in the 4th quarter than in the 2nd quarter at the 0.01 level of significance? If yes, write the regression equation in the spaces provided, rounded to two decimal places. Else, select "There is not enough evidence." Monthly Sales Number of Dealerships 1st Quarter (1 if Jan.-Mar., 0 otherwise) 2nd Quarter (1 if Apr.-Jun., 0 otherwise) 3rd Quarter (1 if Jul.-Sep., 0 otherwise) 4th Quarter (1 if Oct.-Dec., 0 otherwise) 85482 4 1 0 0 0 101319 9 1 0 0 0 121389 12 1 0 0 0 133677 18 1 0 0 0 194588 22 1 0 0 0 82128 4 0 1 0 0 150407 9 0 1 0 0 242714 12 0…