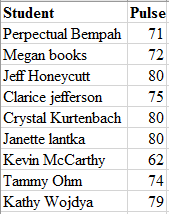
The accompanying data represent the pulse rates (beats per minute) of nine students enrolled in a statistics course. Treat the nine students as a population. Complete parts (a) through (c). Click the icon to view the data on the students' pulse rates.
The accompanying data represent the pulse rates (beats per minute) of nine students enrolled in a statistics course. Treat the nine students as a population. Complete parts (a) through (c). Click the icon to view the data on the students' pulse rates.

Glencoe Algebra 1, Student Edition, 9780079039897, 0079039898, 2018
18th Edition
ISBN:9780079039897
Author:Carter
Publisher:Carter
Chapter10: Statistics
Section10.3: Measures Of Spread
Problem 3CYU

Related questions
Question

Transcribed Image Text:The accompanying data represent the pulse rates (beats per minute) of nine students enrolled in a statistics course. Treat the nine students as a population.
Complete parts (a) through (c).
: Click the icon to view the data on the students' pulse rates.
(a) Compute the population standard deviation.
beats per minute
(Round to one decimal place as needed.)
(b) Determine the sample standard deviation of the following three simple random samples of size 3.
Sample 1: {Janette, Kevin, Tammy}
Sample 2: {Megan, Kevin, Tammy}
Sample 3: {Crystal, Jeff, Kevin}
The sample standard deviation, s, of sample 1, {Janette, Kevin, Tammy}, is
(Round to one decimal place as needed.)
beats per minute.
The sample standard deviation, s, of sample 2, {Megan, Kevin, Tammy}, is beats per minute.
(Round to one decimal place as needed.)
The sample standard deviation, s, of sample 3, {Crystal, Jeff, Kevin}, is
beats per minute
(Round to one decimal place as needed.)
(c) Which samples underestimate the population standard deviation? Which overestimate the population standard deviation?
Sample 1
V the population standard deviation.
Sample 2
V the population standard deviation.
Sample 3
V the population standard deviation.
Expert Solution
Step 1
(a)
Step1: Enter the data in the worksheet. The screenshot will be:
Step 2: Use formula to calculate population standard deviation as:
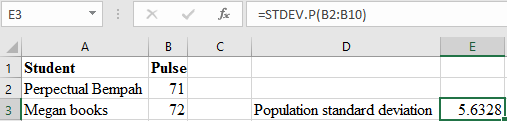
Part a
The population standard deviation is computed as 5.6328.

Trending now
This is a popular solution!

Step by step
Solved in 2 steps with 4 images

Recommended textbooks for you
Glencoe Algebra 1, Student Edition, 9780079039897…
Algebra
ISBN:
9780079039897
Author:
Carter
Publisher:
McGraw Hill

Big Ideas Math A Bridge To Success Algebra 1: Stu…
Algebra
ISBN:
9781680331141
Author:
HOUGHTON MIFFLIN HARCOURT
Publisher:
Houghton Mifflin Harcourt
Glencoe Algebra 1, Student Edition, 9780079039897…
Algebra
ISBN:
9780079039897
Author:
Carter
Publisher:
McGraw Hill
Big Ideas Math A Bridge To Success Algebra 1: Stu…
Algebra
ISBN:
9781680331141
Author:
HOUGHTON MIFFLIN HARCOURT
Publisher:
Houghton Mifflin Harcourt