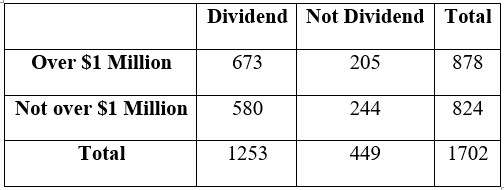
QUESTION 10 In a sample of 1702 companies from year 2000, there are 878 companies that pay a stock dividend to its shareholders, there are 1253 companies that pay their CEO's over $1 million in total compensation, and there are 673 firms that pay a dividend and pay their CEO's over S1 million in total compensations. The following table describes this joint distribution. Dividend Not Dividend Total Over $1 Million Not over $1 million Total 673 205 878 580 244 824 1253 449 1702 When testing the hypothesis (using the 5% level of significance) that the compensation of the CEO and whether the company pays a dividend are independent, what is the test statistic? (please round your answer to 3 decimal places).
QUESTION 10 In a sample of 1702 companies from year 2000, there are 878 companies that pay a stock dividend to its shareholders, there are 1253 companies that pay their CEO's over $1 million in total compensation, and there are 673 firms that pay a dividend and pay their CEO's over S1 million in total compensations. The following table describes this joint distribution. Dividend Not Dividend Total Over $1 Million Not over $1 million Total 673 205 878 580 244 824 1253 449 1702 When testing the hypothesis (using the 5% level of significance) that the compensation of the CEO and whether the company pays a dividend are independent, what is the test statistic? (please round your answer to 3 decimal places).

Calculus For The Life Sciences
2nd Edition
ISBN:9780321964038
Author:GREENWELL, Raymond N., RITCHEY, Nathan P., Lial, Margaret L.
Publisher:GREENWELL, Raymond N., RITCHEY, Nathan P., Lial, Margaret L.
Chapter7: Integration
Section7.CR: Chapter 7 Review
Problem 88CR

Related questions

Concept explainers
Contingency Table
A contingency table can be defined as the visual representation of the relationship between two or more categorical variables that can be evaluated and registered. It is a categorical version of the scatterplot, which is used to investigate the linear relationship between two variables. A contingency table is indeed a type of frequency distribution table that displays two variables at the same time.
Binomial Distribution
Binomial is an algebraic expression of the sum or the difference of two terms. Before knowing about binomial distribution, we must know about the binomial theorem.
Topic Video
Question

Transcribed Image Text:QUESTION 10
In a sample of 1702 companies from year 2000, there are 878 companies that pay a stock dividend to its
shareholders, there are 1253 companies that pay their CEO's over $1 million in total compensation, and there are
673 firms that pay a dividend and pay their CEO's over $1 million in total compensations. The following table
describes this joint distribution.
Dividend
Not Dividend
Total
Over $1 Million
Not over $1 million
Total
673
205
878
580
244
824
1253
449
1702
When testing the hypothesis (using the 5% level of significance) that the compensation of the CEO and whether
the company pays a dividend are independent, what is the test statistic? (please round your answer to 3 decimal
places).
Expert Solution
Step 1
The given table is as follows:

Trending now
This is a popular solution!

Step by step
Solved in 2 steps with 3 images

Knowledge Booster


Learn more about
Need a deep-dive on the concept behind this application? Look no further. Learn more about this topic, statistics and related others by exploring similar questions and additional content below.Recommended textbooks for you
Calculus For The Life Sciences
Calculus
ISBN:
9780321964038
Author:
GREENWELL, Raymond N., RITCHEY, Nathan P., Lial, Margaret L.
Publisher:
Pearson Addison Wesley,

Algebra & Trigonometry with Analytic Geometry
Algebra
ISBN:
9781133382119
Author:
Swokowski
Publisher:
Cengage

Calculus For The Life Sciences
Calculus
ISBN:
9780321964038
Author:
GREENWELL, Raymond N., RITCHEY, Nathan P., Lial, Margaret L.
Publisher:
Pearson Addison Wesley,
Algebra & Trigonometry with Analytic Geometry
Algebra
ISBN:
9781133382119
Author:
Swokowski
Publisher:
Cengage
