The numbers of accidents which occur on an assembly line each week over a 2 year period are summarised in Table 1. Table 1: Number of accidents, 0 1 2 23456780 3 5 6 8 Frequency 1 HNSKO2I2 14 21 36 18 9 1 (a) Use the data to compute the sample mean number of accidents recorded per area. (b) Suppose the data in Table 1 follows a Poisson distribution. Calculate the theoretical Poisson(A = 3) probabilities for integers in the range 0 to 9 inclusive.
The numbers of accidents which occur on an assembly line each week over a 2 year period are summarised in Table 1. Table 1: Number of accidents, 0 1 2 23456780 3 5 6 8 Frequency 1 HNSKO2I2 14 21 36 18 9 1 (a) Use the data to compute the sample mean number of accidents recorded per area. (b) Suppose the data in Table 1 follows a Poisson distribution. Calculate the theoretical Poisson(A = 3) probabilities for integers in the range 0 to 9 inclusive.
Glencoe Algebra 1, Student Edition, 9780079039897, 0079039898, 2018
18th Edition
ISBN:9780079039897
Author:Carter
Publisher:Carter
Chapter10: Statistics
Section10.5: Comparing Sets Of Data
Problem 13PPS
Related questions
Question

Transcribed Image Text:The numbers of accidents which occur on an assembly line each week over a
2 year period are summarised in Table 1.
Table 1:
Number of accidents, 2
0
1
2
3
4
5
6
8
Frequency
1
14
21
36
18
9
2
1
2
(a) Use the data to compute the sample mean number of accidents recorded
per area.
(b) Suppose the data in Table 1 follows a Poisson distribution. Calculate the
theoretical Poisson (A = 3) probabilities for integers in the range 0 to 9
inclusive.
Expert Solution
This question has been solved!
Explore an expertly crafted, step-by-step solution for a thorough understanding of key concepts.
Step by step
Solved in 4 steps

Follow-up Questions
Read through expert solutions to related follow-up questions below.
Follow-up Question

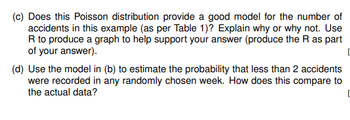
Transcribed Image Text:(c) Does this Poisson distribution provide a good model for the number of
accidents in this example (as per Table 1)? Explain why or why not. Use
R to produce a graph to help support your answer (produce the R as part
of your answer).
[
(d) Use the model in (b) to estimate the probability that less than 2 accidents
were recorded in any randomly chosen week. How does this compare to
the actual data?
Solution
Recommended textbooks for you

Glencoe Algebra 1, Student Edition, 9780079039897…
Algebra
ISBN:
9780079039897
Author:
Carter
Publisher:
McGraw Hill

Calculus For The Life Sciences
Calculus
ISBN:
9780321964038
Author:
GREENWELL, Raymond N., RITCHEY, Nathan P., Lial, Margaret L.
Publisher:
Pearson Addison Wesley,

Glencoe Algebra 1, Student Edition, 9780079039897…
Algebra
ISBN:
9780079039897
Author:
Carter
Publisher:
McGraw Hill

Calculus For The Life Sciences
Calculus
ISBN:
9780321964038
Author:
GREENWELL, Raymond N., RITCHEY, Nathan P., Lial, Margaret L.
Publisher:
Pearson Addison Wesley,